OPEN-SOURCE SCRIPT
Moving Averages Histogram
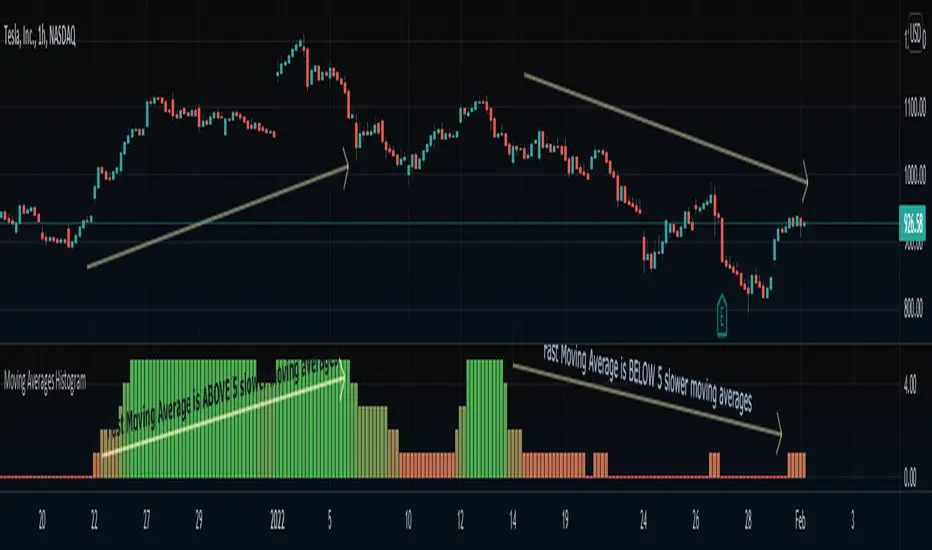
An interesting idea is to simplify the display of whether ONE fast-moving average crosses FIVE other slower-moving averages using just a histogram.
The idea is to increase the step counter by 1 every time a fast-moving average crosses OVER one of the five slower-moving averages until reaching 5 (highest value) and decrease the step counter by 1 every time the fast-moving average crosses UNDER each one of the five slower moving averages until reaching 0 (lowest value of the histogram).
=== Cut To Chase ===
If the histogram is at the top value 5 (green), it means the FAST moving average is ABOVE ALL slower-moving averages, Hench, the asset is up trending.
If the histogram is at the bottom value 0 (red), it means the FAST moving average is BELOW ALL slower-moving averages, Hench, the asset is down trending.
If the histogram is in the midways between 0 to 5, it means the FAST moving average is starting to cross the slower moving averages which could lead to a trend reversal, up or down, it depends on the direction of the crossing.
=== Notes ===
You can change from a variety of moving averages like RMA, EMA, ALMA, HMA, and so on.
You can reduce the number of slow-moving averages by placing the same length.
You can visualize the moving averages in case you want to see how it works behind, by going to settings and clicking 'Show MA lines'.
Every moving average length can be modified inside settings.
Note that the fast-moving average should have the lowest length.
You can visualize how the moving average is plotted:
오픈 소스 스크립트
트레이딩뷰의 진정한 정신에 따라, 이 스크립트의 작성자는 이를 오픈소스로 공개하여 트레이더들이 기능을 검토하고 검증할 수 있도록 했습니다. 작성자에게 찬사를 보냅니다! 이 코드는 무료로 사용할 수 있지만, 코드를 재게시하는 경우 하우스 룰이 적용된다는 점을 기억하세요.
Appreciation of my work: paypal.me/dman103
All Premium indicators: algo.win
LIVE Stream - Pivot Points Algo: youtube.com/channel/UCFyqab-i0xb2jf-c18ufH0A/live
All Premium indicators: algo.win
LIVE Stream - Pivot Points Algo: youtube.com/channel/UCFyqab-i0xb2jf-c18ufH0A/live
면책사항
해당 정보와 게시물은 금융, 투자, 트레이딩 또는 기타 유형의 조언이나 권장 사항으로 간주되지 않으며, 트레이딩뷰에서 제공하거나 보증하는 것이 아닙니다. 자세한 내용은 이용 약관을 참조하세요.