OPEN-SOURCE SCRIPT
Daily Time Theory
Daily Time Theory Indicator
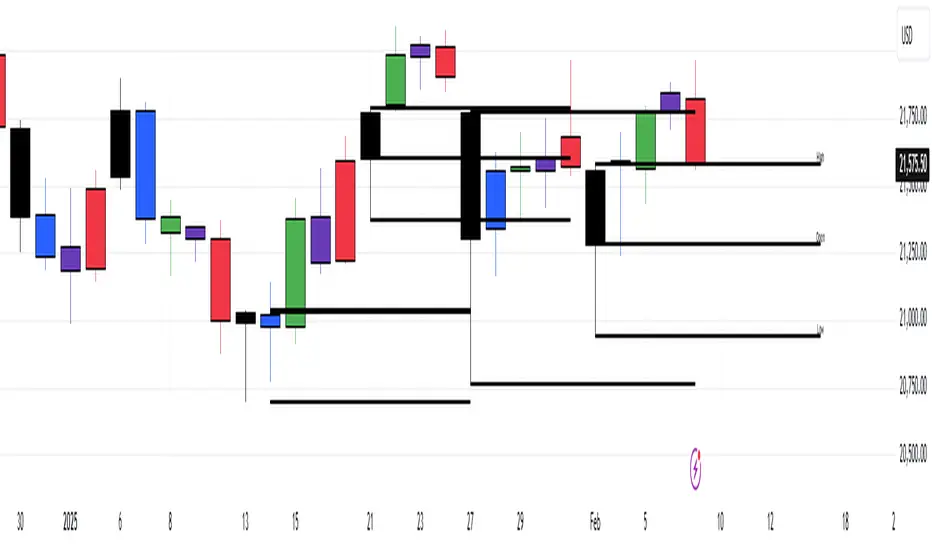
The Daily Time Theory indicator is a versatile tool designed exclusively for daily charts. It dynamically colors daily candles according to the day of the week using customizable colors, making it easy to visually distinguish between Monday through Friday. In addition, it provides the option to display horizontal lines for key price levels (Open, High, Low, and Close) for each day. These lines extend into the future for a user-defined number of weeks, giving traders a clear view of historical support and resistance levels.
Key Features:
Day-Based Candle Coloring:
Each weekday’s candles are automatically colored based on user-defined color settings (e.g. blue for Monday, green for Tuesday, etc.), enhancing chart clarity and enabling quick visual analysis of daily patterns.
Customizable Price Level Lines:
Traders can toggle on or off the display of the Open, High, Low, and Close price levels for each day. This allows you to focus on the specific data points that are most relevant to your trading strategy.
Extended Projections:
The indicator lets you extend the drawn price level lines for multiple weeks. This feature provides insight into historical price levels and helps identify potential support and resistance areas.
Tiny Labels for Clarity:
Each line drawn comes with a small, unobtrusive label at its far right that clearly indicates whether the line represents the Open, High, Low, or Close. This ensures that you always know which price level is being highlighted without cluttering the chart.
User-Friendly Input Grouping:
The inputs are neatly organized into groups by day, making it simple to adjust colors and toggle settings for each weekday independently.
How It Works:
The indicator automatically detects the current day on a daily chart and assigns a corresponding color to the candles.
It stores each day’s Open, High, Low, and Close values using persistent variables so that historical price levels remain visible.
When toggled on, horizontal lines representing the selected price levels are drawn across the chart. A tiny label is attached to the end of each line, indicating the type of price level.
The extended lines allow you to see how historical daily price levels may act as support or resistance in the future.
Usage Recommendations:
This indicator is best used on daily timeframes for markets with regular trading sessions. It is ideal for traders who wish to analyze intra-week price behavior, identify recurring support and resistance levels, and incorporate daily price structure into their trading strategy.
오픈 소스 스크립트
트레이딩뷰의 진정한 정신에 따라, 이 스크립트의 작성자는 이를 오픈소스로 공개하여 트레이더들이 기능을 검토하고 검증할 수 있도록 했습니다. 작성자에게 찬사를 보냅니다! 이 코드는 무료로 사용할 수 있지만, 코드를 재게시하는 경우 하우스 룰이 적용된다는 점을 기억하세요.
면책사항
해당 정보와 게시물은 금융, 투자, 트레이딩 또는 기타 유형의 조언이나 권장 사항으로 간주되지 않으며, 트레이딩뷰에서 제공하거나 보증하는 것이 아닙니다. 자세한 내용은 이용 약관을 참조하세요.
오픈 소스 스크립트
트레이딩뷰의 진정한 정신에 따라, 이 스크립트의 작성자는 이를 오픈소스로 공개하여 트레이더들이 기능을 검토하고 검증할 수 있도록 했습니다. 작성자에게 찬사를 보냅니다! 이 코드는 무료로 사용할 수 있지만, 코드를 재게시하는 경우 하우스 룰이 적용된다는 점을 기억하세요.
면책사항
해당 정보와 게시물은 금융, 투자, 트레이딩 또는 기타 유형의 조언이나 권장 사항으로 간주되지 않으며, 트레이딩뷰에서 제공하거나 보증하는 것이 아닙니다. 자세한 내용은 이용 약관을 참조하세요.