PROTECTED SOURCE SCRIPT
업데이트됨 ORB High/Low
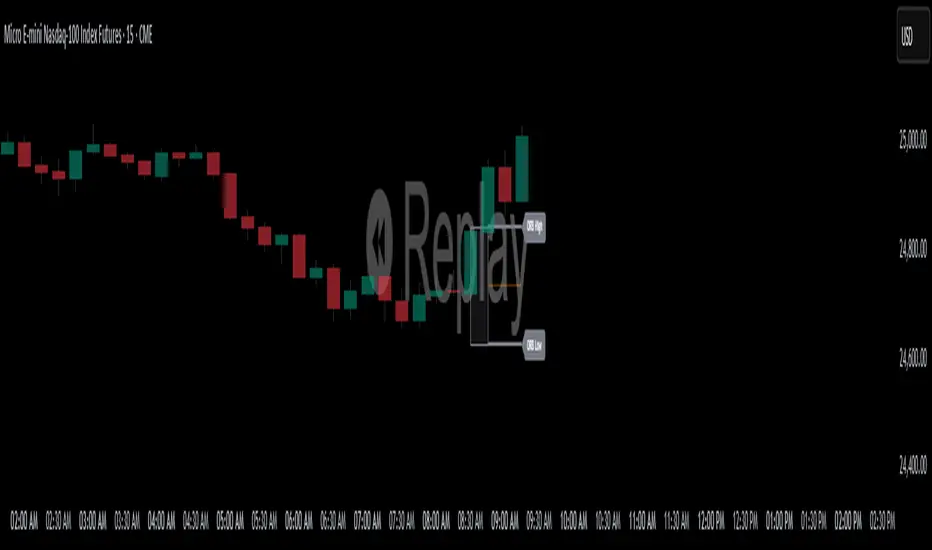
Opening Range High/Low (ORB) Indicator
This indicator plots the Opening Range High and Low (ORB) for a user-defined time window on your chart. It helps traders identify the initial price range after market open, which is commonly used for breakout and trend strategies.
Key Features:
Custom OR Window: Set your own start and end time for the Opening Range. Default is 08:30–08:45 CST.
ORB High/Low Lines: Automatically plots the high and low of the opening range.
Sticky Labels: “ORB High” and “ORB Low” labels follow the lines across the chart for easy visibility.
Shaded Box: Highlights the opening range area with customizable color and opacity.
Custom Colors: Separate colors for lines, shading, and labels, allowing for full chart customization.
Stop Time: Optionally stop plotting OR lines after a specific time.
Daily Reset: Automatically resets at the start of a new day, preventing carryover from the previous session.
Usage:
Identify breakout levels: watch for price to break above ORB High or below ORB Low.
Gauge early market volatility and momentum.
Combine with other technical tools for trend confirmation or intraday strategies.
Ideal For: Intraday and day traders who rely on the first 15 minutes of the trading session to identify key levels and potential breakout points.
릴리즈 노트
ORB High/Low with Stop Time & AlertsDescription:
The ORB (Opening Range Breakout) High/Low indicator is a versatile tool designed to help traders identify the key opening range of a trading session and potential breakout points. It calculates the high and low of a user-defined opening range session, displays lines and labels on the chart, optionally shades the range, and includes alerts for price breaks.
Features:
Customizable Timezone: Choose your local timezone or GMT offset for accurate session tracking.
Opening Range Window: Define the start and end time for the opening range session.
ORB High/Low Lines: Automatically plots the high and low of the defined session.
Shaded Opening Range Box: Optionally highlight the opening range for easier visual analysis.
Stop Time for Lines: Automatically stops extending ORB lines after a specified time.
Sticky Labels: Labels update dynamically and remain attached to the ORB High/Low lines.
Break Alerts: Single alert triggers once per session when price breaks ORB High or Low.
Lightweight and Flexible: Works on any chart timeframe and can be used for multiple assets.
How to Use:
Set your Timezone to match your exchange or preferred session.
Define the Opening Range Window to mark the session you want to track (e.g., 08:30–08:45).
Enable or disable lines, shading, and labels as needed.
Set a Stop ORB Lines Time to automatically stop extending the lines after a certain point.
Create an alert using “Break of High or Low” to be notified when price crosses the ORB High or Low.
Ideal for: Day traders, scalpers, and breakout traders who want a simple, visual reference for opening range levels and potential breakout points.
릴리즈 노트
Added a middle line. Also added more customizable settings such as line thickness, colors, and toggles to turn on/off보호된 스크립트입니다
이 스크립트는 비공개 소스로 게시됩니다. 하지만 이를 자유롭게 제한 없이 사용할 수 있습니다 – 자세한 내용은 여기에서 확인하세요.
면책사항
해당 정보와 게시물은 금융, 투자, 트레이딩 또는 기타 유형의 조언이나 권장 사항으로 간주되지 않으며, 트레이딩뷰에서 제공하거나 보증하는 것이 아닙니다. 자세한 내용은 이용 약관을 참조하세요.
면책사항
해당 정보와 게시물은 금융, 투자, 트레이딩 또는 기타 유형의 조언이나 권장 사항으로 간주되지 않으며, 트레이딩뷰에서 제공하거나 보증하는 것이 아닙니다. 자세한 내용은 이용 약관을 참조하세요.