PROTECTED SOURCE SCRIPT
Buy/Sell Volume VWAP with Liquidity and Price Sensitivity
Buy/Sell Volume VWAP with Liquidity & Price Sensitivity
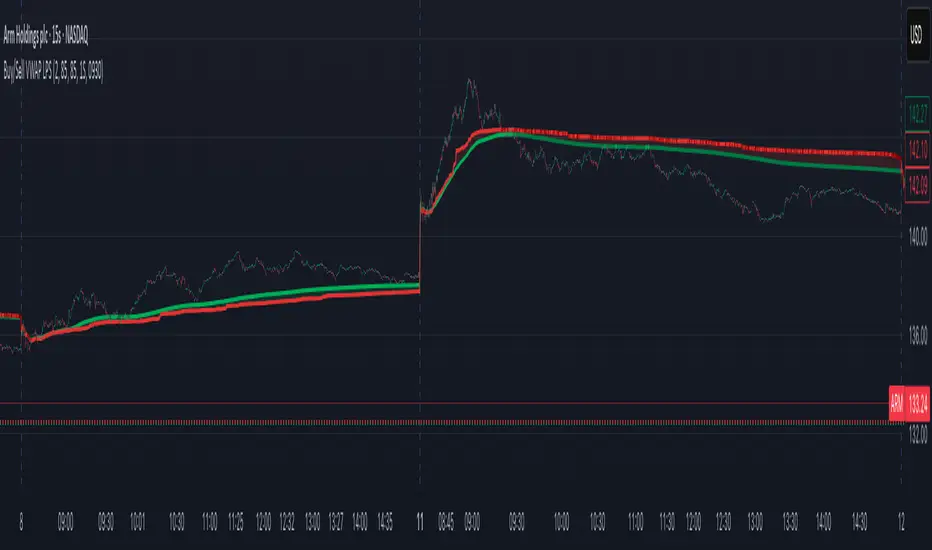
A dual-VWAP overlay that separates buy-side vs sell-side pressure using lower-timeframe volume and recent price behavior. It shows two adaptive VWAP lines and a bias cloud to make trend and imbalance easy to see—no params fussing required.
What you’ll see
Buy VWAP (green) and Sell VWAP (red) plotted on the chart
Slope-aware coloring: brighter when that side is improving, darker when easing
Bias cloud: green when Buy > Sell, red when Sell > Buy
Optional last-value bubbles on the price scale for quick readouts
How it works
Looks inside each bar (lower timeframe, e.g., 1-second) to estimate buy vs sell pressure
Blends that pressure with recent price movement to keep the lines responsive but stable
Maintains separate VWAP tracks for buy-side and sell-side and resets daily or at a time you choose
How to use it
Trend & bias: When Buy VWAP stays above Sell VWAP (green cloud), buyers have the upper hand; the opposite (red cloud) favors sellers.
Conviction: A wider gap between the two lines often means a stronger imbalance.
Context: Use alongside structure (higher highs/lows, key levels) for confirmation—this is not a stand-alone signal.
Inputs
Timeframe: Lower-TF sampling (default 1S).
Reset Time: Defaults to 09:30 (session open); set to your market.
Appearance: Two-shade palettes for buy/sell, line width, last-value bubbles, and cloud opacity.
Tips
Works on most symbols and intraday timeframes; lower-TF sampling can be heavier on resources.
If the cloud flips frequently, consider viewing on a slightly higher chart timeframe for cleaner structure.
Disclaimer
For educational use only. Not investment advice. Test on replay/paper before live decisions.


https://www.tradingview.com/x/xLOyisX6/
A dual-VWAP overlay that separates buy-side vs sell-side pressure using lower-timeframe volume and recent price behavior. It shows two adaptive VWAP lines and a bias cloud to make trend and imbalance easy to see—no params fussing required.
What you’ll see
Buy VWAP (green) and Sell VWAP (red) plotted on the chart
Slope-aware coloring: brighter when that side is improving, darker when easing
Bias cloud: green when Buy > Sell, red when Sell > Buy
Optional last-value bubbles on the price scale for quick readouts
How it works
Looks inside each bar (lower timeframe, e.g., 1-second) to estimate buy vs sell pressure
Blends that pressure with recent price movement to keep the lines responsive but stable
Maintains separate VWAP tracks for buy-side and sell-side and resets daily or at a time you choose
How to use it
Trend & bias: When Buy VWAP stays above Sell VWAP (green cloud), buyers have the upper hand; the opposite (red cloud) favors sellers.
Conviction: A wider gap between the two lines often means a stronger imbalance.
Context: Use alongside structure (higher highs/lows, key levels) for confirmation—this is not a stand-alone signal.
Inputs
Timeframe: Lower-TF sampling (default 1S).
Reset Time: Defaults to 09:30 (session open); set to your market.
Appearance: Two-shade palettes for buy/sell, line width, last-value bubbles, and cloud opacity.
Tips
Works on most symbols and intraday timeframes; lower-TF sampling can be heavier on resources.
If the cloud flips frequently, consider viewing on a slightly higher chart timeframe for cleaner structure.
Disclaimer
For educational use only. Not investment advice. Test on replay/paper before live decisions.
https://www.tradingview.com/x/xLOyisX6/
보호된 스크립트입니다
이 스크립트는 비공개 소스로 게시됩니다. 하지만 이를 자유롭게 제한 없이 사용할 수 있습니다 – 자세한 내용은 여기에서 확인하세요.
면책사항
해당 정보와 게시물은 금융, 투자, 트레이딩 또는 기타 유형의 조언이나 권장 사항으로 간주되지 않으며, 트레이딩뷰에서 제공하거나 보증하는 것이 아닙니다. 자세한 내용은 이용 약관을 참조하세요.
면책사항
해당 정보와 게시물은 금융, 투자, 트레이딩 또는 기타 유형의 조언이나 권장 사항으로 간주되지 않으며, 트레이딩뷰에서 제공하거나 보증하는 것이 아닙니다. 자세한 내용은 이용 약관을 참조하세요.