INVITE-ONLY SCRIPT
Zippo Blaze Crypto
Zippo Blaze Crypto
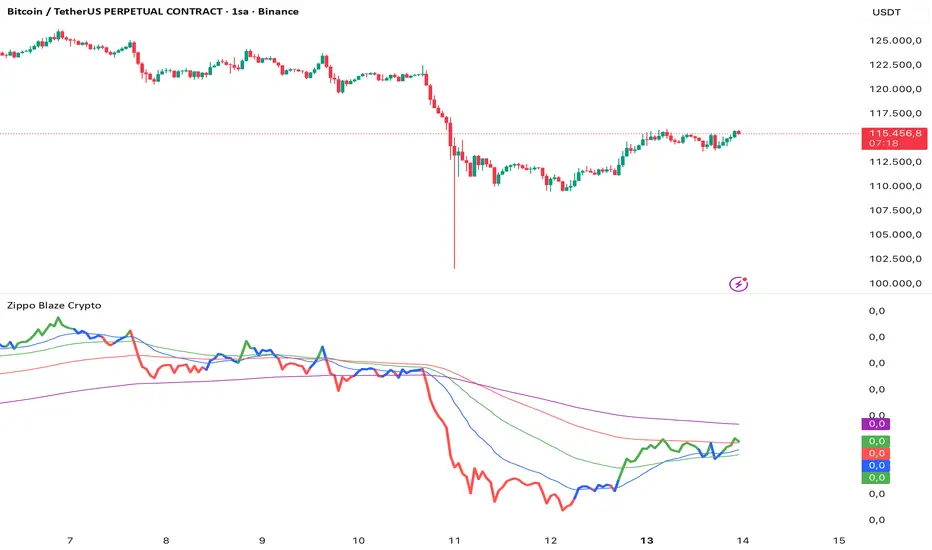
An advanced trend-following indicator that analyzes cryptocurrency price movements by integrating them with major pairs (BTC, ETH, BNB, etc.). It combines the price with these pairs and overall market dynamics to create a main line, colors this line based on momentum, and adds user-adjustable EMAs on top. This provides a balanced trend analysis by considering connections in the crypto market. It only works for cryptocurrencies; it shows no data for other assets (e.g., Borsa Istanbul stocks).
How It Works?
This system operates using a special method that combines crypto prices with major pairs (like BTC, ETH, BNB) and the price itself:
- Price Movement Line: The main line created by normalizing the crypto price with pairs and market data – it shows movement with major coins, but moves in tandem with the price (the line rises when the price rises, falls when it falls) and synchronizes with pairs.
-- Coloring: Determined based on momentum:
🟢 Green: Upward momentum – upward price movement expected.
🔴 Red: Downward momentum – downward price movement expected.
🔵 Blue: Neutral zone – horizontal movement or uncertainty period.
-- EMAs: Moving averages added on top of the main line (EMA 20, 50, 100, 200). Periods can be changed by the user; other calculations are fixed.
This method strengthens signals by utilizing the interconnected structure of the market and reduces optimization risk.
Key Features:
Pair Integration: Integrates price movement with major pairs like BTC, ETH, BNB, providing a connected view instead of an isolated analysis.
Momentum Coloring: Colors the line for quick trend detection – green and red zones give clear signals.
Verification Tools: EMAs verify the direction of the main line; for example, EMAs turning upward can be used as a long signal, downward as a short signal.
Price Action Levels: When viewed on larger time frames (daily, weekly), important support/resistance levels (PA levels) become more apparent.
Crypto-Focused: Only activates on crypto symbols; remains blank in other markets.
How to Use?
-- Price Movement Line: Main trend indicator – moves in sync with pairs, signals long opportunities in uptrends, short in downtrends.
🟢 Green Line: Upward movement expected (evaluate long positions).
🔴 Red Line: Downward movement expected (evaluate short positions).
🔵 Blue Line: Horizontal or neutral period – avoid opening new positions.
- EMAs: Line and EMA crossovers confirm signals; EMAs turning upward can be interpreted as a long signal, downward as short. Monitor PA levels with EMAs on larger periods.
Time Frame and Usage Recommendations
Best results are achieved on hourly and higher time frames (e.g., 1H, 4H, daily), as pair integration and price movement are clearer in these frames.
Signals may weaken in low-liquidity altcoins; ideal for major cryptocurrencies (BTC, ETH, BNB, etc.).
Use EMAs to detect PA levels on larger periods (daily+) – this provides an advantage in long-term trades.
In short time frames, adjust EMA periods for filtering.
Important Warning
This indicator is developed for technical analysis purposes and does not contain investment advice. Market conditions can change rapidly; even pair integration cannot provide full protection against instant fluctuations. Make all your investment decisions based on your own research, risk management strategies, and professional advice.
초대 전용 스크립트
이 스크립트는 작성자가 승인한 사용자만 접근할 수 있습니다. 사용하려면 요청을 보내고 승인을 받아야 합니다. 일반적으로 결제 후에 승인이 이루어집니다. 자세한 내용은 아래 작성자의 지침을 따르거나 Zippo_Javie에게 직접 문의하세요.
트레이딩뷰는 스크립트 작성자를 완전히 신뢰하고 스크립트 작동 방식을 이해하지 않는 한 스크립트 비용을 지불하거나 사용하지 않는 것을 권장하지 않습니다. 무료 오픈소스 대체 스크립트는 커뮤니티 스크립트에서 찾을 수 있습니다.
작성자 지시 사항
Access Request: This indicator is published as invite-only (access by invitation only). To request access, please message me at https://x.com/bist_imkb. I can provide details on paid access options.
면책사항
이 정보와 게시물은 TradingView에서 제공하거나 보증하는 금융, 투자, 거래 또는 기타 유형의 조언이나 권고 사항을 의미하거나 구성하지 않습니다. 자세한 내용은 이용 약관을 참고하세요.