OPEN-SOURCE SCRIPT
업데이트됨 DEMARSI
This is little tricky indicator but you need to understand how its work in order to make it easy to understand
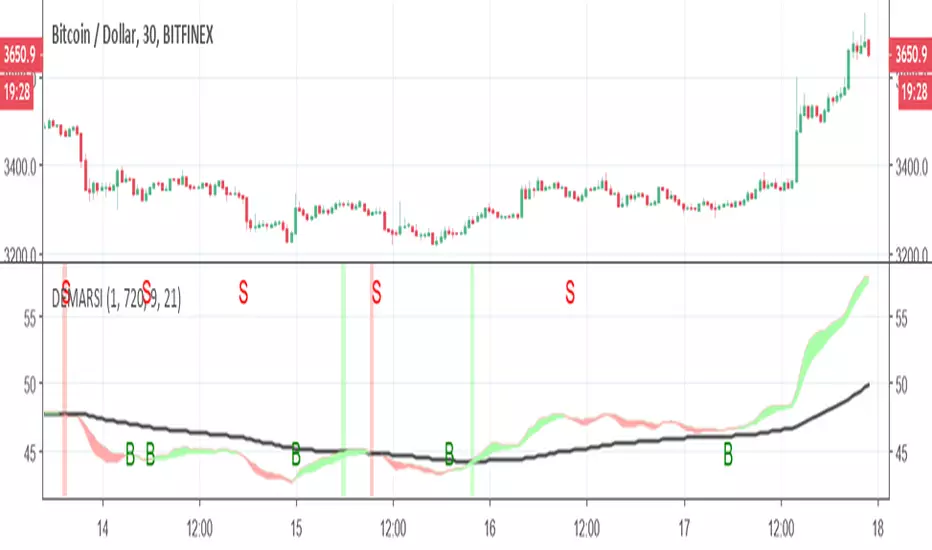
The black line is DEMA RSI hybrid which is made on the MTF length that is not repainting.
The green and red zones are also DEMA RSI that is calculated in different way (the cross between the fast and the slow moving create the color change and the signal.
you can buy or sell using the signals shown (no alerts given) but it easy to add. the since the first MTF DEMA RSI is slower the the other ones we can use it as base . so lets say you enter in green and the second DEMA is still above the black line the trend is still forward and even if you get sell signal you still can hold the coin as it expected to rise further . on the other hand once you get sell signal in red and its fall down bellow black line then it the true end of the buy period. you need to find best condition for your purpose which mean to play with setting (here I put 240 MTF over rsiDEma kegth 21) , other options can be better (did not test it).

here without the cross signals of dema rsi 2

here with MTF 120
The black line is DEMA RSI hybrid which is made on the MTF length that is not repainting.
The green and red zones are also DEMA RSI that is calculated in different way (the cross between the fast and the slow moving create the color change and the signal.
you can buy or sell using the signals shown (no alerts given) but it easy to add. the since the first MTF DEMA RSI is slower the the other ones we can use it as base . so lets say you enter in green and the second DEMA is still above the black line the trend is still forward and even if you get sell signal you still can hold the coin as it expected to rise further . on the other hand once you get sell signal in red and its fall down bellow black line then it the true end of the buy period. you need to find best condition for your purpose which mean to play with setting (here I put 240 MTF over rsiDEma kegth 21) , other options can be better (did not test it).
here without the cross signals of dema rsi 2
here with MTF 120
릴리즈 노트
so I add buy and sell alerts on the crossing, I think by increasing MTF to 720 it may work better on 30 min graph but did not tested it 릴리즈 노트
I highlight the cross of the two different demarsi 오픈 소스 스크립트
트레이딩뷰의 진정한 정신에 따라, 이 스크립트의 작성자는 이를 오픈소스로 공개하여 트레이더들이 기능을 검토하고 검증할 수 있도록 했습니다. 작성자에게 찬사를 보냅니다! 이 코드는 무료로 사용할 수 있지만, 코드를 재게시하는 경우 하우스 룰이 적용된다는 점을 기억하세요.
면책사항
해당 정보와 게시물은 금융, 투자, 트레이딩 또는 기타 유형의 조언이나 권장 사항으로 간주되지 않으며, 트레이딩뷰에서 제공하거나 보증하는 것이 아닙니다. 자세한 내용은 이용 약관을 참조하세요.
오픈 소스 스크립트
트레이딩뷰의 진정한 정신에 따라, 이 스크립트의 작성자는 이를 오픈소스로 공개하여 트레이더들이 기능을 검토하고 검증할 수 있도록 했습니다. 작성자에게 찬사를 보냅니다! 이 코드는 무료로 사용할 수 있지만, 코드를 재게시하는 경우 하우스 룰이 적용된다는 점을 기억하세요.
면책사항
해당 정보와 게시물은 금융, 투자, 트레이딩 또는 기타 유형의 조언이나 권장 사항으로 간주되지 않으며, 트레이딩뷰에서 제공하거나 보증하는 것이 아닙니다. 자세한 내용은 이용 약관을 참조하세요.