OPEN-SOURCE SCRIPT
업데이트됨 Short Sale Restriction (SSR) Level - Intraday and daily charts
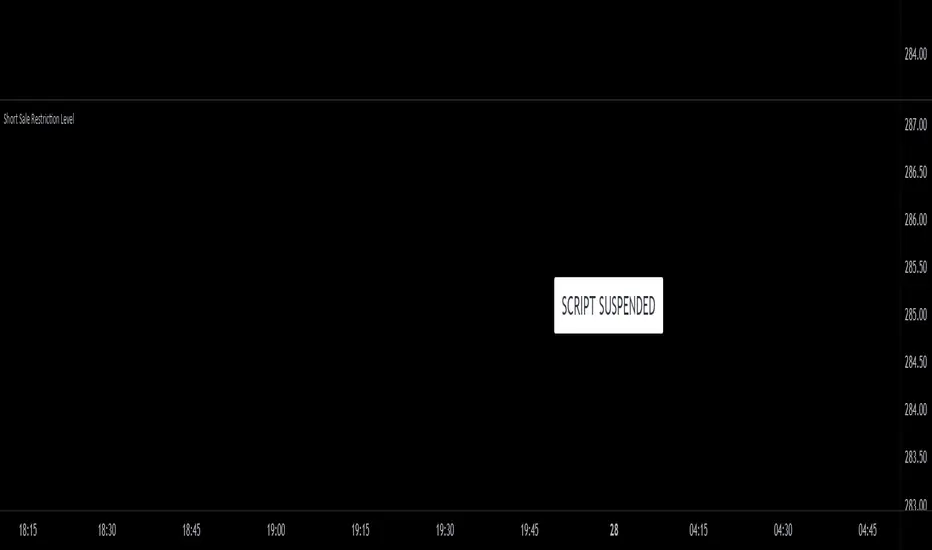
This script plots the Short Sale Restriction (SSR) Level relative to the previous day's closing price. It works on any time frame from 1 minute to daily, showing the correct level even during the extended session.
The Short Sale Restriction (SSR) is a rule of the Securities and Exchange Commission (SEC) that restricts traders from short-selling stocks that are rapidly decreasing in value in an attempt to profit from the price drop. The rule was introduced in 2010, after the 2008 financial crisis, to prevent market manipulation and excessive volatility.
The SSR works as follows: when the price of a particular stock drops 10% compared to the previous day's closing price, the SSR is triggered and a temporary limitation is imposed on traders' ability to short-sell that stock for the rest of the trading day and the following day. During the SSR activation period, traders can still short-sell, but only if the sale is "covered" by another long position on the same stock.
Knowledge of the SSR level is especially important for day traders because it helps them to plan their trading strategies in advance, avoiding situations where short-selling becomes more difficult. Additionally, if a stock has exceeded the SSR threshold, traders can expect an increase in price volatility.
릴리즈 노트
This script is suspended.Following internal changes in how TradingView provides data from lower timeframes, this script no longer functions properly on the daily timeframe and should therefore be suspended.
오픈 소스 스크립트
트레이딩뷰의 진정한 정신에 따라, 이 스크립트의 작성자는 이를 오픈소스로 공개하여 트레이더들이 기능을 검토하고 검증할 수 있도록 했습니다. 작성자에게 찬사를 보냅니다! 이 코드는 무료로 사용할 수 있지만, 코드를 재게시하는 경우 하우스 룰이 적용된다는 점을 기억하세요.
면책사항
해당 정보와 게시물은 금융, 투자, 트레이딩 또는 기타 유형의 조언이나 권장 사항으로 간주되지 않으며, 트레이딩뷰에서 제공하거나 보증하는 것이 아닙니다. 자세한 내용은 이용 약관을 참조하세요.
오픈 소스 스크립트
트레이딩뷰의 진정한 정신에 따라, 이 스크립트의 작성자는 이를 오픈소스로 공개하여 트레이더들이 기능을 검토하고 검증할 수 있도록 했습니다. 작성자에게 찬사를 보냅니다! 이 코드는 무료로 사용할 수 있지만, 코드를 재게시하는 경우 하우스 룰이 적용된다는 점을 기억하세요.
면책사항
해당 정보와 게시물은 금융, 투자, 트레이딩 또는 기타 유형의 조언이나 권장 사항으로 간주되지 않으며, 트레이딩뷰에서 제공하거나 보증하는 것이 아닙니다. 자세한 내용은 이용 약관을 참조하세요.