OPEN-SOURCE SCRIPT
업데이트됨 Percentile Rank of Moving Average Convergence Divergence
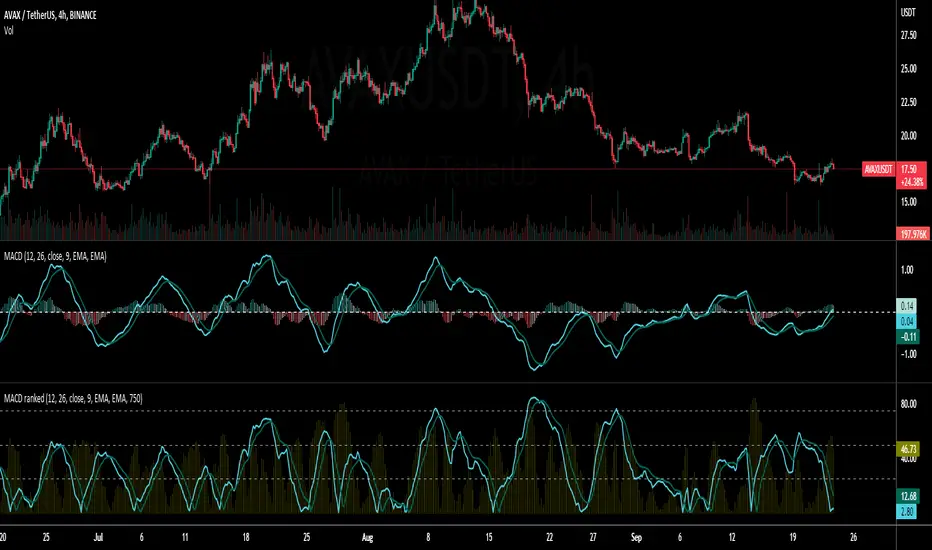
This simple indicator provides you three useful information of the Moving Average Convergence Divergence (MACD) indicator:
This indicator can be useful to identify the strength of trend. This indicator makes the assumption that market tends to revert into the opposite direction. If the market has been trending a lot, it should consolidate for a while later. If the market has been consolidating for a long time, it would begin trending real soon.
When we see a low percentile rank, no matter which line it is, this tells that the market hasn't been moving much, or there is little momentum. If the percentile rank stays below the median or even below the first quartile for a long time, this could suggest that the market is ready for the next trend since it has stored quite some energy.
When we see a high percentile rank, no matter which line it is, this tells that the market has been trending a lot, or there is much momentum. If the percentile rank stays above the median or even above the third quartile for a long time, it is probable that the market has used up much of its energy and is going to take a rest (consolidate).
- The percentile rank of the current value of the MACD line, displayed by the bright blue line.
- The percentile rank of the current value of the Signal line, displayed by the dark blue line.
- The percentile rank of the current value of the Histogram line, displayed by the olive histogram.
This indicator can be useful to identify the strength of trend. This indicator makes the assumption that market tends to revert into the opposite direction. If the market has been trending a lot, it should consolidate for a while later. If the market has been consolidating for a long time, it would begin trending real soon.
When we see a low percentile rank, no matter which line it is, this tells that the market hasn't been moving much, or there is little momentum. If the percentile rank stays below the median or even below the first quartile for a long time, this could suggest that the market is ready for the next trend since it has stored quite some energy.
When we see a high percentile rank, no matter which line it is, this tells that the market has been trending a lot, or there is much momentum. If the percentile rank stays above the median or even above the third quartile for a long time, it is probable that the market has used up much of its energy and is going to take a rest (consolidate).
릴리즈 노트
Update the picture of how the indicator should look.오픈 소스 스크립트
트레이딩뷰의 진정한 정신에 따라, 이 스크립트의 작성자는 이를 오픈소스로 공개하여 트레이더들이 기능을 검토하고 검증할 수 있도록 했습니다. 작성자에게 찬사를 보냅니다! 이 코드는 무료로 사용할 수 있지만, 코드를 재게시하는 경우 하우스 룰이 적용된다는 점을 기억하세요.
면책사항
해당 정보와 게시물은 금융, 투자, 트레이딩 또는 기타 유형의 조언이나 권장 사항으로 간주되지 않으며, 트레이딩뷰에서 제공하거나 보증하는 것이 아닙니다. 자세한 내용은 이용 약관을 참조하세요.
오픈 소스 스크립트
트레이딩뷰의 진정한 정신에 따라, 이 스크립트의 작성자는 이를 오픈소스로 공개하여 트레이더들이 기능을 검토하고 검증할 수 있도록 했습니다. 작성자에게 찬사를 보냅니다! 이 코드는 무료로 사용할 수 있지만, 코드를 재게시하는 경우 하우스 룰이 적용된다는 점을 기억하세요.
면책사항
해당 정보와 게시물은 금융, 투자, 트레이딩 또는 기타 유형의 조언이나 권장 사항으로 간주되지 않으며, 트레이딩뷰에서 제공하거나 보증하는 것이 아닙니다. 자세한 내용은 이용 약관을 참조하세요.