PROTECTED SOURCE SCRIPT
Trendinator
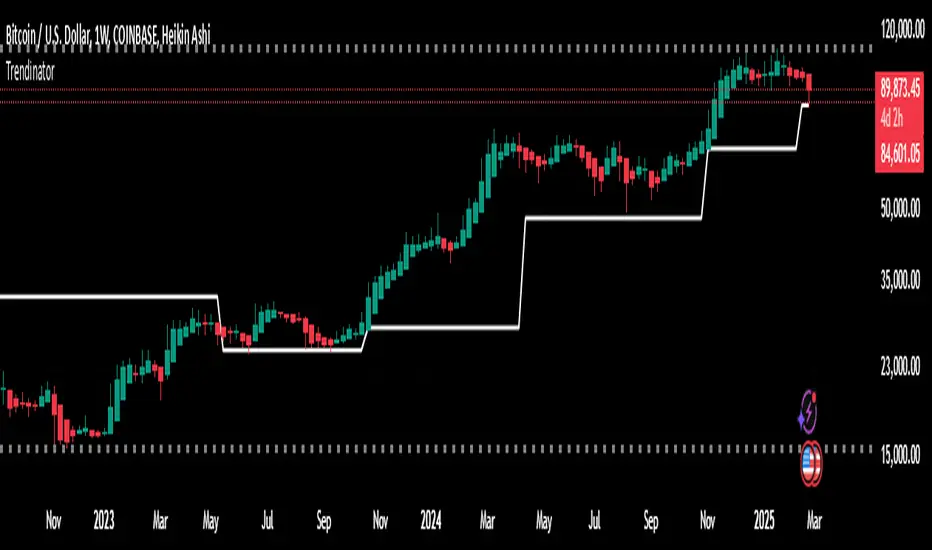
This indicator uses a custom Cumulative Delta Volume (CDV) calculation to dynamically generate support and resistance levels on the chart. It calculates CDV by taking the difference between uptick and downtick volumes, then accumulates these differences over time. From the cumulative delta, the indicator computes a MACD-style line by applying fast and slow exponential moving averages, and further smooths this into a signal line. The difference between the MACD line and its signal line (the histogram) is used to detect key crossover events.
When the CDV MACD line crosses below the signal line, the indicator captures the high of that candle as the new resistance level. Conversely, when the CDV MACD line crosses above the signal line, it captures the low of that candle as the new support level. These levels are maintained until the next corresponding crossover occurs, allowing the indicator to adapt to changes in market sentiment. A dynamic mid line is then calculated as the average of the current support and resistance levels, serving as a central pivot for the market.
Important Notice:
The use of technical indicators like this one does not guarantee profitable results. This indicator should not be used as a standalone analysis tool. It is essential to combine it with other forms of analysis, such as fundamental analysis, risk management strategies, and awareness of current market conditions. Always conduct thorough research.
Note: The effectiveness of any technical indicator can vary based on market conditions and individual trading styles. It's crucial to test indicators thoroughly using historical data before applying them in live trading scenarios.
Disclaimer:
Trading financial instruments involves substantial risk and may not be suitable for all investors. Past performance is not indicative of future results. This indicator is provided for informational and educational purposes only and should not be considered investment advice. Always conduct your own research before making any trading decisions.
보호된 스크립트입니다
이 스크립트는 비공개 소스로 게시됩니다. 하지만 이를 자유롭게 제한 없이 사용할 수 있습니다 – 자세한 내용은 여기에서 확인하세요.
면책사항
해당 정보와 게시물은 금융, 투자, 트레이딩 또는 기타 유형의 조언이나 권장 사항으로 간주되지 않으며, 트레이딩뷰에서 제공하거나 보증하는 것이 아닙니다. 자세한 내용은 이용 약관을 참조하세요.
보호된 스크립트입니다
이 스크립트는 비공개 소스로 게시됩니다. 하지만 이를 자유롭게 제한 없이 사용할 수 있습니다 – 자세한 내용은 여기에서 확인하세요.
면책사항
해당 정보와 게시물은 금융, 투자, 트레이딩 또는 기타 유형의 조언이나 권장 사항으로 간주되지 않으며, 트레이딩뷰에서 제공하거나 보증하는 것이 아닙니다. 자세한 내용은 이용 약관을 참조하세요.