OPEN-SOURCE SCRIPT
업데이트됨 Fibonacci Golden Wave | Flux Charts
💎 GENERAL OVERVIEW
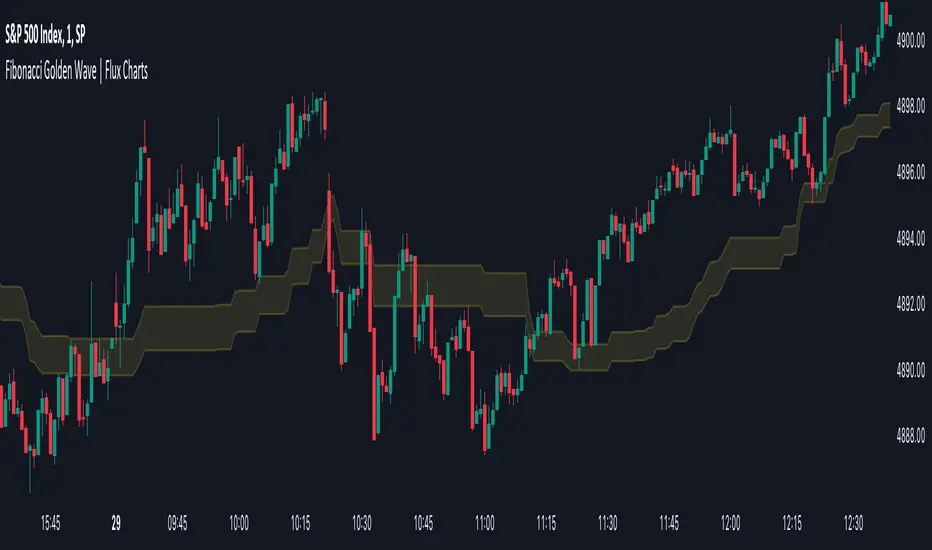
Introducing the new Fibonacci Golden Wave indicator! This indicator plots the Fibonacci golden zone from the last highs / lows instead of the pivots so that the resulting zone is shaped like a "wave". We believe this will help you to see the latest trend of the Fibonacci retracement levels easier. For more information of the working progress of the indicator, check the "How Does It Work" section of the description.

Features of the new Fibonacci Golden Wave Indicator :
🚩UNIQUENESS
The Fibonacci Golden Zone is a widely used concept in trading. To achieve the golden zone, the Fibonacci retracement levels are generally placed between pivot high / lows, resulting in a rectangular zone. However, this indicator will place the Fibonacci retracement levels between the last highest / lowest points going back from the current bar, resulting in a "wave" shape. This will help traders understand the latest trend of the Fibonacci golden zone. The ability to change the Fibonacci retracement levels to your liking in the settings is another unique function of this indicator.
📌 HOW DOES IT WORK ?
To calculate the Fibonacci wave, first of all we need to place a line at the lowest low and the highest high of the last 20 bars (can be changed from the settings)

Then, Fibonacci retracement levels are placed between those lines.

For the next step, put two points in the (1.0 - 0.618) = 0.382 and (1.0 - 0.5) = 0.5 (can be changed from the settings) levels of the Fibonacci retracement.

Repeat this step for each bar in the chart, then connect all the points.
Instead of a pivot approach to the Fibonacci retracement levels, this approach will not need a new pivot point to form before calculating the new Fibonacci golden zone, thus indicating the latest trend of the current golden zone.
🚨HOW YOU CAN USE THIS INDICATOR
Fibonacci retracement tool is typically used to find entries after a pullback in an uptrend or downtrend. The Fibonacci Golden Wave can be used in the same way. It can be used to find entries after markets retrace. In this example, the Fibonacci Golden Wave is able to catch 2 pullback opportunities to enter long in the market with the trend.

⚙️SETTINGS
1. General Configuration
Swing Range -> This setting determines how the highest high / lowest low levels are calculated. This essentially means that the script will look back X bars before the current bar in calculation to find the highest / lowest wick points.
2. Golden Zone
Here you can select which range of the Fibonacci retracement levels should be considered as the golden zone. The default value is 0.5 - 0.618.
Introducing the new Fibonacci Golden Wave indicator! This indicator plots the Fibonacci golden zone from the last highs / lows instead of the pivots so that the resulting zone is shaped like a "wave". We believe this will help you to see the latest trend of the Fibonacci retracement levels easier. For more information of the working progress of the indicator, check the "How Does It Work" section of the description.
Features of the new Fibonacci Golden Wave Indicator :
- Plots Fibonacci Golden Zone Based On Highs / Lows
- A Different Approach To Fibonacci Retracement Levels
- Customizable Swing Range & Retracement Levels
- Customizable Visuals
🚩UNIQUENESS
The Fibonacci Golden Zone is a widely used concept in trading. To achieve the golden zone, the Fibonacci retracement levels are generally placed between pivot high / lows, resulting in a rectangular zone. However, this indicator will place the Fibonacci retracement levels between the last highest / lowest points going back from the current bar, resulting in a "wave" shape. This will help traders understand the latest trend of the Fibonacci golden zone. The ability to change the Fibonacci retracement levels to your liking in the settings is another unique function of this indicator.
📌 HOW DOES IT WORK ?
To calculate the Fibonacci wave, first of all we need to place a line at the lowest low and the highest high of the last 20 bars (can be changed from the settings)
Then, Fibonacci retracement levels are placed between those lines.
For the next step, put two points in the (1.0 - 0.618) = 0.382 and (1.0 - 0.5) = 0.5 (can be changed from the settings) levels of the Fibonacci retracement.
Repeat this step for each bar in the chart, then connect all the points.
Instead of a pivot approach to the Fibonacci retracement levels, this approach will not need a new pivot point to form before calculating the new Fibonacci golden zone, thus indicating the latest trend of the current golden zone.
🚨HOW YOU CAN USE THIS INDICATOR
Fibonacci retracement tool is typically used to find entries after a pullback in an uptrend or downtrend. The Fibonacci Golden Wave can be used in the same way. It can be used to find entries after markets retrace. In this example, the Fibonacci Golden Wave is able to catch 2 pullback opportunities to enter long in the market with the trend.
⚙️SETTINGS
1. General Configuration
Swing Range -> This setting determines how the highest high / lowest low levels are calculated. This essentially means that the script will look back X bars before the current bar in calculation to find the highest / lowest wick points.
2. Golden Zone
Here you can select which range of the Fibonacci retracement levels should be considered as the golden zone. The default value is 0.5 - 0.618.
릴리즈 노트
- Removed rendering limits
오픈 소스 스크립트
트레이딩뷰의 진정한 정신에 따라, 이 스크립트의 작성자는 이를 오픈소스로 공개하여 트레이더들이 기능을 검토하고 검증할 수 있도록 했습니다. 작성자에게 찬사를 보냅니다! 이 코드는 무료로 사용할 수 있지만, 코드를 재게시하는 경우 하우스 룰이 적용된다는 점을 기억하세요.
Access Flux Charts' exclusive indicators: fluxcharts.com/
Join our Discord community: discord.gg/FluxCharts
Join our Discord community: discord.gg/FluxCharts
면책사항
해당 정보와 게시물은 금융, 투자, 트레이딩 또는 기타 유형의 조언이나 권장 사항으로 간주되지 않으며, 트레이딩뷰에서 제공하거나 보증하는 것이 아닙니다. 자세한 내용은 이용 약관을 참조하세요.