PROTECTED SOURCE SCRIPT
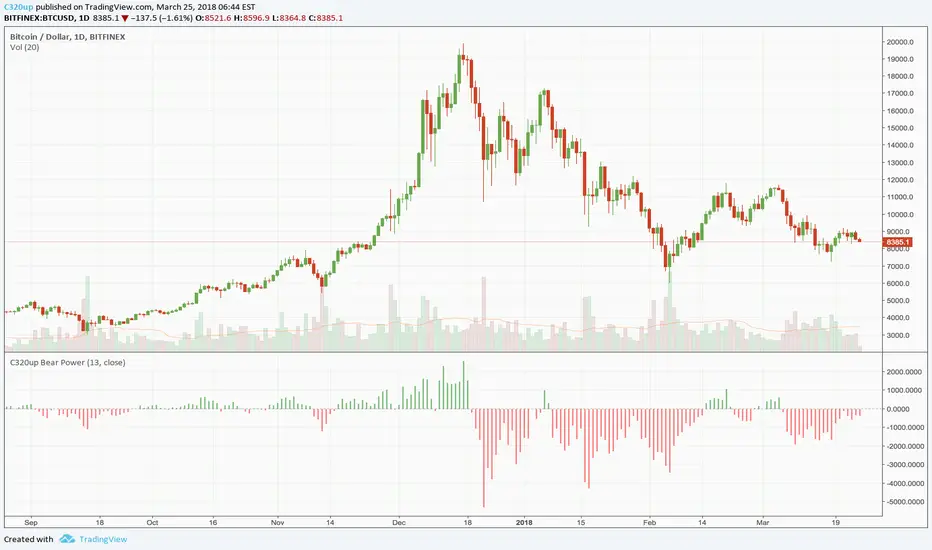
C320up Bear Power

C320up Bear Power
“The Bears Power oscillator was developed by Alexander Elder. It measures the difference between the lowest price and a 13-day Exponential Moving Average (EMA), plotted as a histogram. If the Bears Power indicator is below zero, it means sellers were able to drive price below the EMA. If the Bears Power indicator is above zero, it means buyers were able to keep the lowest price above the EMA. Bears Power is a fully unbounded oscillator with a base value of 0 and has no lower or upper limit. The indicator is often used in combination with other signals.” ~ TradingView
You can customise the colours of this indicator or change from histogram to area, line, etc., or a combination of these.
The default colours are Green (Bulls) for above zero, and Red (Bears) for below zero.
This indicator is not to be confused with Elder’s Force Index, which uses SMA and Volume.
보호된 스크립트입니다
이 스크립트는 비공개 소스로 게시됩니다. 하지만 이를 자유롭게 제한 없이 사용할 수 있습니다 – 자세한 내용은 여기에서 확인하세요.
면책사항
해당 정보와 게시물은 금융, 투자, 트레이딩 또는 기타 유형의 조언이나 권장 사항으로 간주되지 않으며, 트레이딩뷰에서 제공하거나 보증하는 것이 아닙니다. 자세한 내용은 이용 약관을 참조하세요.
보호된 스크립트입니다
이 스크립트는 비공개 소스로 게시됩니다. 하지만 이를 자유롭게 제한 없이 사용할 수 있습니다 – 자세한 내용은 여기에서 확인하세요.
면책사항
해당 정보와 게시물은 금융, 투자, 트레이딩 또는 기타 유형의 조언이나 권장 사항으로 간주되지 않으며, 트레이딩뷰에서 제공하거나 보증하는 것이 아닙니다. 자세한 내용은 이용 약관을 참조하세요.