INVITE-ONLY SCRIPT
Multi-Symbol Options Trading Indicator
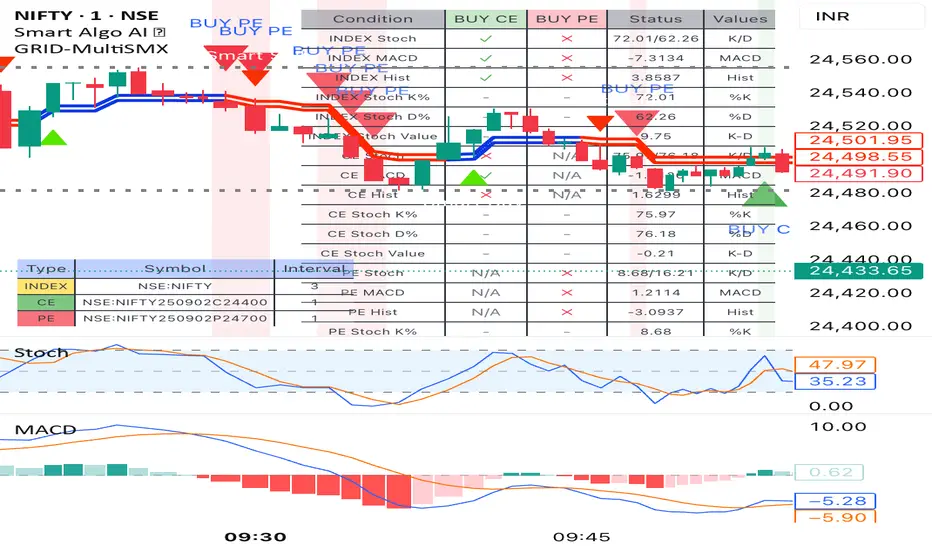
Symbol Configuration: User can input three different symbols (INDEX, CE, PE) with individual timeframes
Customizable Settings: Fully editable MACD and Stochastic parameters
Signal Generation:
BUY CE: When INDEX shows bullish signals AND CE option shows bullish signals
BUY PE: When INDEX shows bearish signals AND PE option shows bullish signals
Signal Conditions:
BUY CE Signal (all must be true):
INDEX: Stochastic %K > %D
INDEX: MACD line > Signal line
INDEX: Histogram shows bullish trend over specified bars
CE: Stochastic %K > %D
CE: MACD line > Signal line
CE: Histogram shows bullish trend over specified bars
BUY PE Signal (all must be true):
INDEX: Stochastic %K < %D
INDEX: MACD line < Signal line
INDEX: Histogram shows bearish trend over specified bars
PE: Stochastic %K > %D
PE: MACD line > Signal line
PE: Histogram shows bullish trend over specified bars
Visual Elements:
Green triangle up with "BUY CE" text when CE signal triggers
Red triangle down with "BUY PE" text when PE signal triggers
Background coloring on signal candles
Conditions table showing real-time status of all conditions
Alerts for both signal types
Usage Instructions:
Add the indicator to your chart
Configure your three symbols (INDEX, CE option, PE option)
Set timeframes for each symbol
Adjust MACD and Stochastic parameters as needed
Set the number of histogram bars for trend analysis
Enable/disable the conditions table and choose its position
The table will show you exactly which conditions are met (✓) or not met (✗) for both signal types, making it easy to monitor the setup in real-time.
초대 전용 스크립트
이 스크립트는 작성자가 승인한 사용자만 접근할 수 있습니다. 사용하려면 요청 후 승인을 받아야 하며, 일반적으로 결제 후에 허가가 부여됩니다. 자세한 내용은 아래 작성자의 안내를 따르거나 sailor_joe에게 직접 문의하세요.
트레이딩뷰는 스크립트의 작동 방식을 충분히 이해하고 작성자를 완전히 신뢰하지 않는 이상, 해당 스크립트에 비용을 지불하거나 사용하는 것을 권장하지 않습니다. 커뮤니티 스크립트에서 무료 오픈소스 대안을 찾아보실 수도 있습니다.
작성자 지시 사항
Pls mail josegejo@gmail.com or contact +91 9846040278
면책사항
해당 정보와 게시물은 금융, 투자, 트레이딩 또는 기타 유형의 조언이나 권장 사항으로 간주되지 않으며, 트레이딩뷰에서 제공하거나 보증하는 것이 아닙니다. 자세한 내용은 이용 약관을 참조하세요.