OPEN-SOURCE SCRIPT
업데이트됨 Normalized True Range - Grouped by Weekdays
This indicator helps traders analyze daily volatility patterns across different days of the week by calculating normalized price ranges.
These bounds appear as horizontal lines on the chart, making it easy to spot when current volatility breaks out of its historical norms.
These bounds appear as horizontal lines on the chart, making it easy to spot when current volatility breaks out of its historical norms.
릴리즈 노트
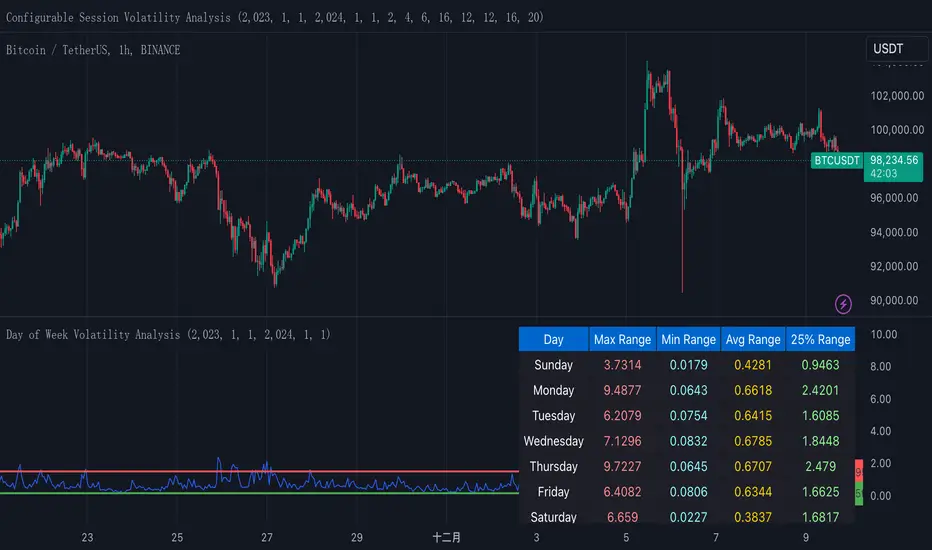
This indicator helps traders analyze daily volatility patterns across different days of the week by calculating normalized price ranges.Unlike traditional volatility measures, it uses a normalized approach by dividing the daily range (high-low) by the midpoint price and multiplying by 100, providing a percentage-based measure that's comparable across different price levels. This normalization makes it particularly useful for comparing volatility patterns across different assets or time periods.
The indicator also includes a statistical overlay that highlights extreme volatility events. By calculating the 5th and 95th percentiles of the normalized ranges within your specified date range, it creates upper and lower bounds that help identify outlier days where volatility was exceptionally high or low.
These bounds appear as horizontal lines on the chart, making it easy to spot when current volatility breaks out of its historical norms.
The data is presented in both visual and tabular formats, with a comprehensive table showing the maximum, minimum, average, and 25th percentile ranges for each day of the week. This dual presentation allows traders to both quickly spot patterns visually and access detailed statistics for deeper analysis.
The user can customize the analysis period through simple date range inputs, making it flexible for different analytical timeframes.
오픈 소스 스크립트
트레이딩뷰의 진정한 정신에 따라, 이 스크립트의 작성자는 이를 오픈소스로 공개하여 트레이더들이 기능을 검토하고 검증할 수 있도록 했습니다. 작성자에게 찬사를 보냅니다! 이 코드는 무료로 사용할 수 있지만, 코드를 재게시하는 경우 하우스 룰이 적용된다는 점을 기억하세요.
면책사항
해당 정보와 게시물은 금융, 투자, 트레이딩 또는 기타 유형의 조언이나 권장 사항으로 간주되지 않으며, 트레이딩뷰에서 제공하거나 보증하는 것이 아닙니다. 자세한 내용은 이용 약관을 참조하세요.
오픈 소스 스크립트
트레이딩뷰의 진정한 정신에 따라, 이 스크립트의 작성자는 이를 오픈소스로 공개하여 트레이더들이 기능을 검토하고 검증할 수 있도록 했습니다. 작성자에게 찬사를 보냅니다! 이 코드는 무료로 사용할 수 있지만, 코드를 재게시하는 경우 하우스 룰이 적용된다는 점을 기억하세요.
면책사항
해당 정보와 게시물은 금융, 투자, 트레이딩 또는 기타 유형의 조언이나 권장 사항으로 간주되지 않으며, 트레이딩뷰에서 제공하거나 보증하는 것이 아닙니다. 자세한 내용은 이용 약관을 참조하세요.