OPEN-SOURCE SCRIPT
High Volume Engulfing Candle_bullHorn

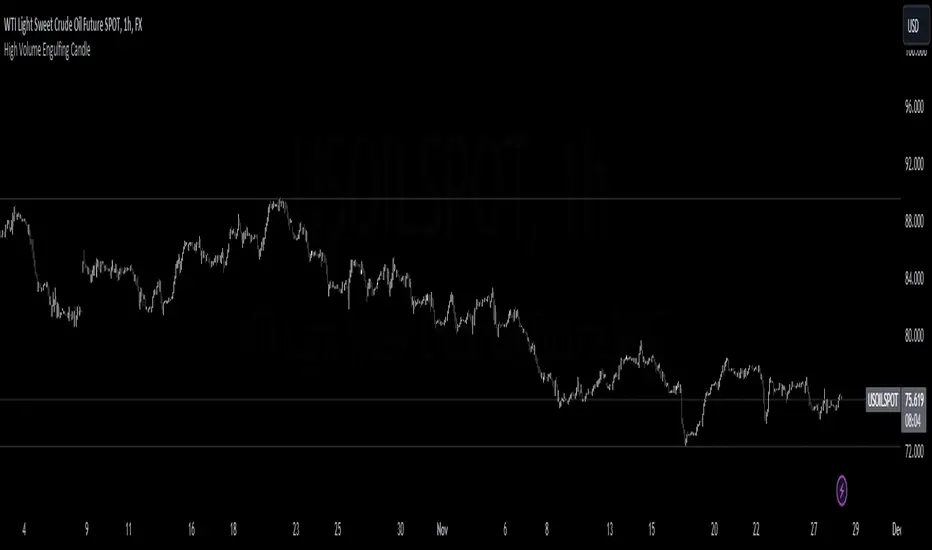
The "High Volume Engulfing Candle" indicator is a technical analysis tool used in trading to identify specific candlestick patterns that suggest potential reversals or significant price movements in a financial instrument. It focuses on two key criteria: the engulfing candlestick pattern and high trading volume. Here's a brief description of the indicator:
Engulfing Candlestick Pattern: The indicator looks for bullish and bearish engulfing candlestick patterns.
Bullish Engulfing: This pattern occurs when the current candlestick completely engulfs the previous one. In other words, the current candlestick's body (the open and close prices) is larger than the previous candlestick's body, and it closes higher than the previous candle's close. It suggests a potential bullish reversal.
Bearish Engulfing: This pattern occurs when the current candlestick's body completely engulfs the previous one, but in the opposite direction. The current candlestick's body is larger than the previous candlestick's body, and it closes lower than the previous candle's close. It suggests a potential bearish reversal.
High Volume Confirmation: In addition to the engulfing pattern, the indicator considers trading volume. It looks for instances where the volume accompanying the engulfing candle is significantly higher than a moving average of the volume. This indicates strong market participation and validates the importance of the engulfing candle pattern.
Arrows on the Chart: When a high volume engulfing candle pattern is detected, the indicator plots arrows on the price chart. A green triangle pointing up is used for bullish engulfing patterns, while a red triangle pointing down is used for bearish engulfing patterns. These arrows help traders quickly identify potential reversal points.
Overall, the "High Volume Engulfing Candle" indicator combines the visual recognition of candlestick patterns with volume analysis to provide traders with potential signals for trend reversals or significant price moves in the market. Traders can use these signals as part of their technical analysis and trading strategies.
오픈 소스 스크립트
트레이딩뷰의 진정한 정신에 따라, 이 스크립트의 작성자는 이를 오픈소스로 공개하여 트레이더들이 기능을 검토하고 검증할 수 있도록 했습니다. 작성자에게 찬사를 보냅니다! 이 코드는 무료로 사용할 수 있지만, 코드를 재게시하는 경우 하우스 룰이 적용된다는 점을 기억하세요.
면책사항
해당 정보와 게시물은 금융, 투자, 트레이딩 또는 기타 유형의 조언이나 권장 사항으로 간주되지 않으며, 트레이딩뷰에서 제공하거나 보증하는 것이 아닙니다. 자세한 내용은 이용 약관을 참조하세요.
오픈 소스 스크립트
트레이딩뷰의 진정한 정신에 따라, 이 스크립트의 작성자는 이를 오픈소스로 공개하여 트레이더들이 기능을 검토하고 검증할 수 있도록 했습니다. 작성자에게 찬사를 보냅니다! 이 코드는 무료로 사용할 수 있지만, 코드를 재게시하는 경우 하우스 룰이 적용된다는 점을 기억하세요.
면책사항
해당 정보와 게시물은 금융, 투자, 트레이딩 또는 기타 유형의 조언이나 권장 사항으로 간주되지 않으며, 트레이딩뷰에서 제공하거나 보증하는 것이 아닙니다. 자세한 내용은 이용 약관을 참조하세요.