OPEN-SOURCE SCRIPT
Quadratic MA
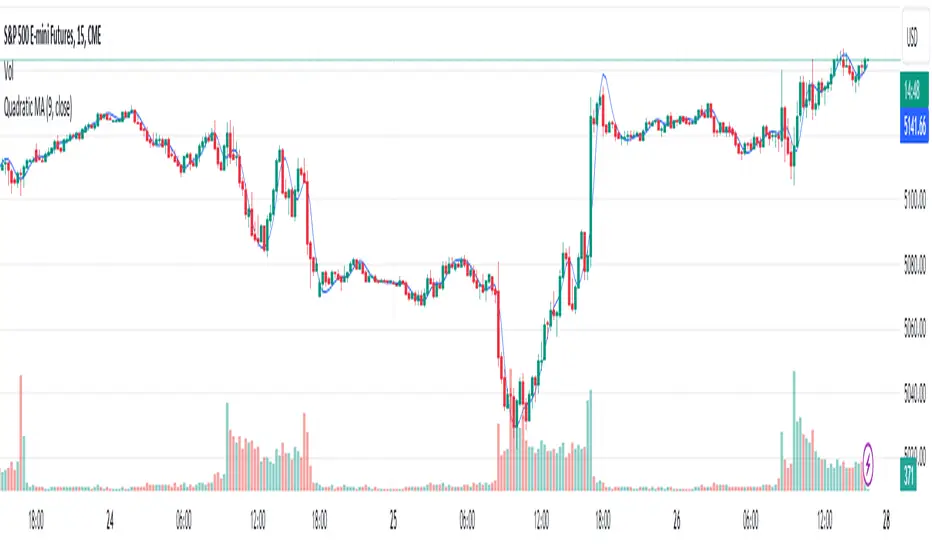
The Quadratic Moving Average (QMA) is an advanced smoothing indicator that provides a smoother and more responsive moving average by applying the Weighted Moving Average (WMA) methodology in a unique, multi-layered approach. This indicator is especially useful for identifying trends in highly volatile markets where data points vary significantly.
Calculation:
The QMA is calculated by first determining a basic WMA over half the specified period and then modifying it by subtracting the WMA over the full period, effectively emphasizing recent price changes. This result is then re-smoothed using another WMA function applied over the square root of the specified length, providing a quadratic enhancement to the typical WMA.
Usage:
The QMA can be particularly effective in trend-following strategies. When the price moves above the QMA line, it may indicate a bullish trend, suggesting a potential buy signal. Conversely, if the price falls below the QMA line, it may signal a bearish trend, indicating a potential sell signal.
Settings:
Length: Controls the sensitivity of the QMA to price changes. A shorter length will make the QMA more responsive to price changes, while a longer length will smooth out the moving average further, potentially reducing the number of signals and noise.
Tips:
Combine the QMA with other forms of analysis, such as volume indicators or momentum oscillators, to confirm trends and refine trading signals.
Adjust the length parameter according to your trading style and the asset's volatility to optimize performance.
오픈 소스 스크립트
트레이딩뷰의 진정한 정신에 따라, 이 스크립트의 작성자는 이를 오픈소스로 공개하여 트레이더들이 기능을 검토하고 검증할 수 있도록 했습니다. 작성자에게 찬사를 보냅니다! 이 코드는 무료로 사용할 수 있지만, 코드를 재게시하는 경우 하우스 룰이 적용된다는 점을 기억하세요.
면책사항
해당 정보와 게시물은 금융, 투자, 트레이딩 또는 기타 유형의 조언이나 권장 사항으로 간주되지 않으며, 트레이딩뷰에서 제공하거나 보증하는 것이 아닙니다. 자세한 내용은 이용 약관을 참조하세요.
오픈 소스 스크립트
트레이딩뷰의 진정한 정신에 따라, 이 스크립트의 작성자는 이를 오픈소스로 공개하여 트레이더들이 기능을 검토하고 검증할 수 있도록 했습니다. 작성자에게 찬사를 보냅니다! 이 코드는 무료로 사용할 수 있지만, 코드를 재게시하는 경우 하우스 룰이 적용된다는 점을 기억하세요.
면책사항
해당 정보와 게시물은 금융, 투자, 트레이딩 또는 기타 유형의 조언이나 권장 사항으로 간주되지 않으며, 트레이딩뷰에서 제공하거나 보증하는 것이 아닙니다. 자세한 내용은 이용 약관을 참조하세요.