OPEN-SOURCE SCRIPT
업데이트됨 Benner-Fibonacci Reversal Points [CC]
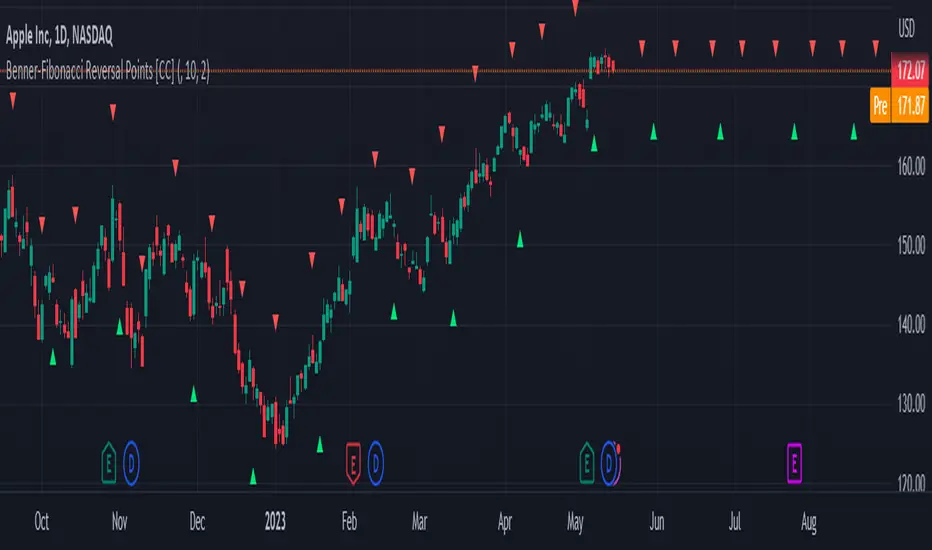
This is an original script based on a very old idea called the Benner Theory from the Civil War times. Benner discovered a pattern in pig iron prices (no clue what those are), and this turned out to be a parallel idea to indicators based on Fibonacci numbers. Because a year is 365 days (nearly 377, which is a Fibonacci number), made up of 52 weeks (nearly 55, which is another Fibonacci number), or 12 months (nearly 13, which is another Fibonacci number), Benner theorized that he could find both past and future turning points in the market by using a pattern he found. He discovered that peaks in prices seemed to follow a pattern of 8-9-10, meaning that after a recent peak, it would be 8 bars until the next peak, 9 bars until after that peak for the next, and 10 bars until the following peak. For past peaks, he would just need to reverse this pattern, and so the previous peak would be 10 bars before the most current peak, 9 bars before that peak, and 8 bars before the previous one, and these patterns seemed to repeat. For troughs, he found a pattern of 16,18,20 which follows the same logic, and this idea also seemed to work on long-term peaks and troughs as well.
This is my version of the Benner theory and the major difference between my version and his is that he would manually select a year or date and either work backwards or forwards from that point. I chose to go with an adaptive version that will automatically detect those points and plot those past and future points. I have included several options such as allowing the algorithm to be calculated in reverse which seems to work well for Crypto for some reason. I also have both short and long term options to only show one or both if you choose and of course the option to enable repainting or leave it disabled.
Big thanks to @HeWhoMustNotBeNamed and @RicardoSantos for helping me fix some bugs in my code and for @kerpiciwuasile for suggesting this idea in the first place.
릴리즈 노트
Made some slight code changes릴리즈 노트
Fixed issue with some tickers giving an error when trying to load the indicator릴리즈 노트
Added alert conditions for current reversal points found오픈 소스 스크립트
트레이딩뷰의 진정한 정신에 따라, 이 스크립트의 작성자는 이를 오픈소스로 공개하여 트레이더들이 기능을 검토하고 검증할 수 있도록 했습니다. 작성자에게 찬사를 보냅니다! 이 코드는 무료로 사용할 수 있지만, 코드를 재게시하는 경우 하우스 룰이 적용된다는 점을 기억하세요.
I created the largest stock indicator library:
github.com/ooples/
Custom Indicator Requests:
forms.gle/ouMffZR3dQ8bSJQG7
Tips are appreciated:
paypal.me/cheatcountry
patreon.com/cheatcountry
github.com/ooples/
Custom Indicator Requests:
forms.gle/ouMffZR3dQ8bSJQG7
Tips are appreciated:
paypal.me/cheatcountry
patreon.com/cheatcountry
면책사항
해당 정보와 게시물은 금융, 투자, 트레이딩 또는 기타 유형의 조언이나 권장 사항으로 간주되지 않으며, 트레이딩뷰에서 제공하거나 보증하는 것이 아닙니다. 자세한 내용은 이용 약관을 참조하세요.
오픈 소스 스크립트
트레이딩뷰의 진정한 정신에 따라, 이 스크립트의 작성자는 이를 오픈소스로 공개하여 트레이더들이 기능을 검토하고 검증할 수 있도록 했습니다. 작성자에게 찬사를 보냅니다! 이 코드는 무료로 사용할 수 있지만, 코드를 재게시하는 경우 하우스 룰이 적용된다는 점을 기억하세요.
I created the largest stock indicator library:
github.com/ooples/
Custom Indicator Requests:
forms.gle/ouMffZR3dQ8bSJQG7
Tips are appreciated:
paypal.me/cheatcountry
patreon.com/cheatcountry
github.com/ooples/
Custom Indicator Requests:
forms.gle/ouMffZR3dQ8bSJQG7
Tips are appreciated:
paypal.me/cheatcountry
patreon.com/cheatcountry
면책사항
해당 정보와 게시물은 금융, 투자, 트레이딩 또는 기타 유형의 조언이나 권장 사항으로 간주되지 않으며, 트레이딩뷰에서 제공하거나 보증하는 것이 아닙니다. 자세한 내용은 이용 약관을 참조하세요.