INVITE-ONLY SCRIPT
업데이트됨 Candles Preview MTF
Description:
The script displays a mini-chart with candlesticks from different symbols and timeframes (up to 8 in total). It can display up to 24 candles. You can use it on any timeframe, but it is intended to work with the same or higher timeframes than the chart's. For example: you can add a mini-chart displaying candles of the chart's symbol from Weekly timeframe, while being on Daily timeframe. The script updates in realtime, but it is not recommended to use it on very low timeframes (1 second for example).
Below you can find some examples of using the indicator:
https://www.tradingview.com/x/2XKBLERi/
(custom colors, highest and lowest volume in footer, symbol name with exchange in header)

(a chart with Weekly and a chart with Monthly candles, custom colors, no footer, timeframe in header)

(charts for 5 different stocks, no footer, symbol name in header)
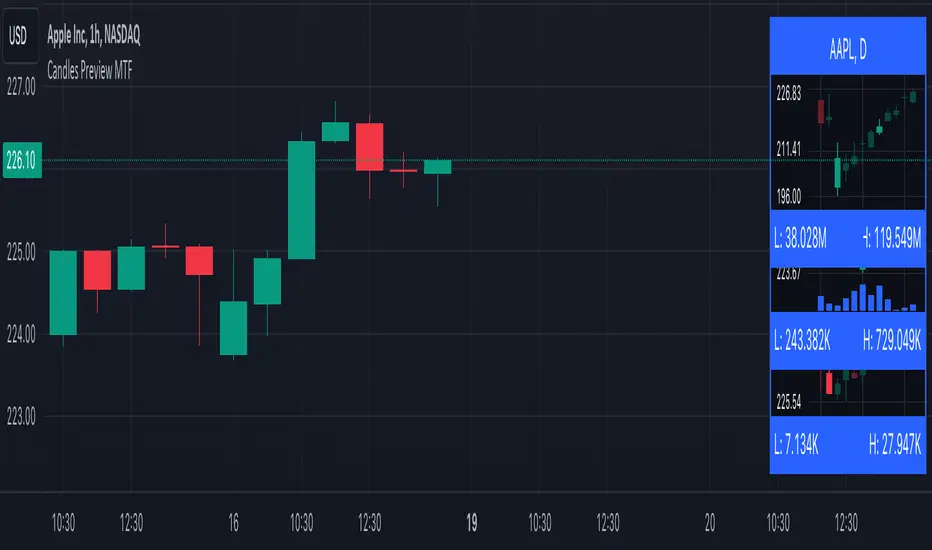
Along with the chart it displays a header with Symbol and Timeframe, as well as footer with highest and lowest Price or Volume for selected number of candles. Each candle displays a tooltip with the following information when hovered:
- Date / Time
- Open, High, Low and Close prices
- Price change (absolute and %)
- Volume
- Volume change (absolute and %)
By default the interface changes colors if you switch to / from "Dark mode", but you can also manually customise any colors to your likings. You can also hide both header and footer, customise what information is displayed in them, show / hide the chart's grid and change its "density", choose position and height for each of the 8 charts. Additionally, you can change the timezone used to calculate time and date.
Inputs:
The indicator's inputs are separated into groups:
- Other (contains the "Timezone" parameter)
- Chart 1 (contains parameters specific for each chart)
- Chart 2
- Chart N
- ...
- Charts (contains parameters that modify all the 8 charts)
- Colors (contains parameters for styling)
How to get it:
Contact me on Tradingview using private chat, and I will grant you a 3 day trial access
On a side note:
You can share your feedback or ideas in the comments, it will help me improve the indicator. Refer to "Release notes" section for any future updates. Thank you!
The script displays a mini-chart with candlesticks from different symbols and timeframes (up to 8 in total). It can display up to 24 candles. You can use it on any timeframe, but it is intended to work with the same or higher timeframes than the chart's. For example: you can add a mini-chart displaying candles of the chart's symbol from Weekly timeframe, while being on Daily timeframe. The script updates in realtime, but it is not recommended to use it on very low timeframes (1 second for example).
Below you can find some examples of using the indicator:
https://www.tradingview.com/x/2XKBLERi/
(custom colors, highest and lowest volume in footer, symbol name with exchange in header)
(a chart with Weekly and a chart with Monthly candles, custom colors, no footer, timeframe in header)
(charts for 5 different stocks, no footer, symbol name in header)
Along with the chart it displays a header with Symbol and Timeframe, as well as footer with highest and lowest Price or Volume for selected number of candles. Each candle displays a tooltip with the following information when hovered:
- Date / Time
- Open, High, Low and Close prices
- Price change (absolute and %)
- Volume
- Volume change (absolute and %)
By default the interface changes colors if you switch to / from "Dark mode", but you can also manually customise any colors to your likings. You can also hide both header and footer, customise what information is displayed in them, show / hide the chart's grid and change its "density", choose position and height for each of the 8 charts. Additionally, you can change the timezone used to calculate time and date.
Inputs:
The indicator's inputs are separated into groups:
- Other (contains the "Timezone" parameter)
- Chart 1 (contains parameters specific for each chart)
- Chart 2
- Chart N
- ...
- Charts (contains parameters that modify all the 8 charts)
- Colors (contains parameters for styling)
How to get it:
Contact me on Tradingview using private chat, and I will grant you a 3 day trial access
On a side note:
You can share your feedback or ideas in the comments, it will help me improve the indicator. Refer to "Release notes" section for any future updates. Thank you!
릴리즈 노트
Release notes:17 Aug 2024:
- added support for lower timeframes (including second-based)
- number of charts lowered to 3
- added price scale
- added volume chart
- candle highlighting based on Lowest / Highest price, volume, Rising / Falling volume
- added options to customise candle size, spacing, etc.
초대 전용 스크립트
이 스크립트는 작성자가 승인한 사용자만 접근할 수 있습니다. 사용하려면 요청 후 승인을 받아야 하며, 일반적으로 결제 후에 허가가 부여됩니다. 자세한 내용은 아래 작성자의 안내를 따르거나 sabricat에게 직접 문의하세요.
트레이딩뷰는 스크립트의 작동 방식을 충분히 이해하고 작성자를 완전히 신뢰하지 않는 이상, 해당 스크립트에 비용을 지불하거나 사용하는 것을 권장하지 않습니다. 커뮤니티 스크립트에서 무료 오픈소스 대안을 찾아보실 수도 있습니다.
작성자 지시 사항
Ping me using private chat and I will grant you a 3 day trial access. If after that period you wanna continue using the script, please contact me again for further instructions.
면책사항
해당 정보와 게시물은 금융, 투자, 트레이딩 또는 기타 유형의 조언이나 권장 사항으로 간주되지 않으며, 트레이딩뷰에서 제공하거나 보증하는 것이 아닙니다. 자세한 내용은 이용 약관을 참조하세요.