OPEN-SOURCE SCRIPT
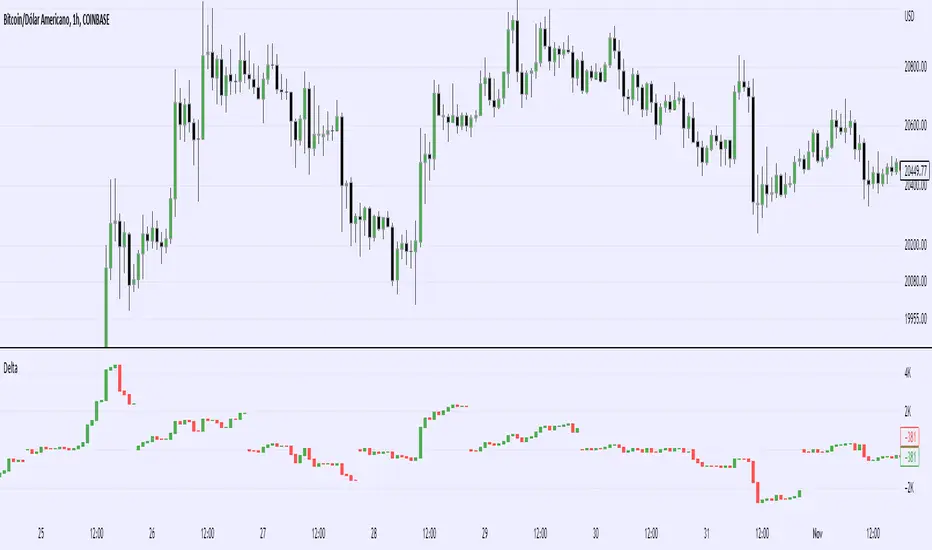
업데이트됨 Real Cummulative Delta (New TV Function)

Thanks to the new TradingView indicator Up/Down Volume, it is now possible to get accurate information on Agression (market buying vs market selling)
However, as they only provide the value of delta, I've made this indicator to show the cummulative value, in the form of candles.
It is great to detect divergences in the macro and in the micro scale (As in divergences in each candle and divergences in higher or lower tops or bottoms)
Hope you can make good use of it!
릴리즈 노트
Oops I made it not visible on Daily charts, should be fixed now릴리즈 노트
Fixed indicator not visible on certain assets and timeframesPS: Traders e investidores Brasileiros em busca de um Assessor XP Investimentos dedicado e capaz de criar e utilizar ferramentas de qualidade para trazer o melhor acompanhamento aos seus clientes, podem entrar em contato comigo aqui nos comentários ou via DM no Twitter
릴리즈 노트
Added option to choose wether to reset on start of day/month/year.오픈 소스 스크립트
트레이딩뷰의 진정한 정신에 따라, 이 스크립트의 작성자는 이를 오픈소스로 공개하여 트레이더들이 기능을 검토하고 검증할 수 있도록 했습니다. 작성자에게 찬사를 보냅니다! 이 코드는 무료로 사용할 수 있지만, 코드를 재게시하는 경우 하우스 룰이 적용된다는 점을 기억하세요.
면책사항
해당 정보와 게시물은 금융, 투자, 트레이딩 또는 기타 유형의 조언이나 권장 사항으로 간주되지 않으며, 트레이딩뷰에서 제공하거나 보증하는 것이 아닙니다. 자세한 내용은 이용 약관을 참조하세요.
오픈 소스 스크립트
트레이딩뷰의 진정한 정신에 따라, 이 스크립트의 작성자는 이를 오픈소스로 공개하여 트레이더들이 기능을 검토하고 검증할 수 있도록 했습니다. 작성자에게 찬사를 보냅니다! 이 코드는 무료로 사용할 수 있지만, 코드를 재게시하는 경우 하우스 룰이 적용된다는 점을 기억하세요.
면책사항
해당 정보와 게시물은 금융, 투자, 트레이딩 또는 기타 유형의 조언이나 권장 사항으로 간주되지 않으며, 트레이딩뷰에서 제공하거나 보증하는 것이 아닙니다. 자세한 내용은 이용 약관을 참조하세요.