OPEN-SOURCE SCRIPT
ZigZag++ Fibonacci
Auto Fibonacci tools are powerful ways designed to simplify your technical analysis by automatically drawing Fibonacci retracement and extension levels on your chart. This indicator is built to enhance your trading experience with clearer market moves and informative insights.
You can easily spot your waves and patterns when the percentages are moving with you.
Key Features:
Automated Fibonacci Levels: Plots Fibonacci retracement and extension levels based on recent price movements.
Multi-Timeframe Support: This indicator is your versatile companion, offering multi-timeframe functionality. You can seamlessly track Fibonacci levels across different resolutions, providing a comprehensive view of the market.
Two Types of Fibs: Retracement and Timeframe extension Fibonacci levels. Use retracements to identify potential reversal points and extensions to anticipate price targets, giving you a well-rounded perspective on market movements.
Benefits:
For the math lovers
I started creating the ZigZag++ based on the MT4 calculation as I found it better performing than the tradingview inbuilt one. I have revised the calculation couple of times and now the final calculation is simple yet more accurate for my analysis.
First, I observe the market direction for the last Depth setting by comparing the rate at which high values reduce and low values increase. When the number of ticks set by Deviation is crossed and the last cross is more than the Backstep candles, then we have our ZigZag points.
These are the points we use in our Fibonacci calculation.
Checkout ZigLib below to use the same logic in your scripts.
Sample usage

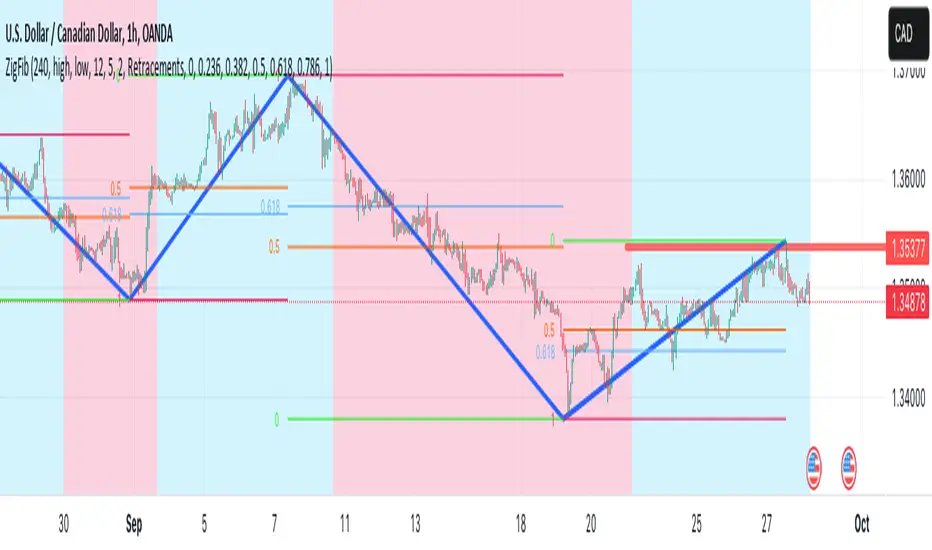
This is a 4 Hour configuration with the default settings.
When the trend reversed, some key points I watch are 0.618 and 0.5. The market retraced back and formed the new point for the next ZigZag line on that level. This market behaviour happens quite often on these Fibonacci points. I would be looking for reversal or a break in this zone to know the next step.
Resources
ZigZag++ Lib by me; for retrieving the line points.
Fibonacci Toolkit by Lux Algo; For drawing the Timeframe Fibs. Very Amazing script.
You can easily spot your waves and patterns when the percentages are moving with you.
Key Features:
Automated Fibonacci Levels: Plots Fibonacci retracement and extension levels based on recent price movements.
Multi-Timeframe Support: This indicator is your versatile companion, offering multi-timeframe functionality. You can seamlessly track Fibonacci levels across different resolutions, providing a comprehensive view of the market.
Two Types of Fibs: Retracement and Timeframe extension Fibonacci levels. Use retracements to identify potential reversal points and extensions to anticipate price targets, giving you a well-rounded perspective on market movements.
Benefits:
- Save Time: No more manual Fibonacci drawing; It does this for you in real-time.
- Enhanced Analysis: Gain a deeper understanding of potential support, resistance, and price targets.
- User-Friendly: Suitable for traders of all levels, this indicator simplifies complex technical analysis.
For the math lovers
I started creating the ZigZag++ based on the MT4 calculation as I found it better performing than the tradingview inbuilt one. I have revised the calculation couple of times and now the final calculation is simple yet more accurate for my analysis.
First, I observe the market direction for the last Depth setting by comparing the rate at which high values reduce and low values increase. When the number of ticks set by Deviation is crossed and the last cross is more than the Backstep candles, then we have our ZigZag points.
These are the points we use in our Fibonacci calculation.
Checkout ZigLib below to use the same logic in your scripts.
Sample usage
This is a 4 Hour configuration with the default settings.
When the trend reversed, some key points I watch are 0.618 and 0.5. The market retraced back and formed the new point for the next ZigZag line on that level. This market behaviour happens quite often on these Fibonacci points. I would be looking for reversal or a break in this zone to know the next step.
Resources
ZigZag++ Lib by me; for retrieving the line points.
Fibonacci Toolkit by Lux Algo; For drawing the Timeframe Fibs. Very Amazing script.
오픈 소스 스크립트
트레이딩뷰의 진정한 정신에 따라, 이 스크립트의 작성자는 이를 오픈소스로 공개하여 트레이더들이 기능을 검토하고 검증할 수 있도록 했습니다. 작성자에게 찬사를 보냅니다! 이 코드는 무료로 사용할 수 있지만, 코드를 재게시하는 경우 하우스 룰이 적용된다는 점을 기억하세요.
🤖🤖🤖🤖🤖🤖🤖🤖🤖🤖
Automate TradingView Alerts
tradingview.to?ref=bih
🥰😍😍🥰😍😍🥰😍😍🥰
Automate TradingView Alerts
tradingview.to?ref=bih
🥰😍😍🥰😍😍🥰😍😍🥰
면책사항
해당 정보와 게시물은 금융, 투자, 트레이딩 또는 기타 유형의 조언이나 권장 사항으로 간주되지 않으며, 트레이딩뷰에서 제공하거나 보증하는 것이 아닙니다. 자세한 내용은 이용 약관을 참조하세요.