OPEN-SOURCE SCRIPT
Consecutive count backtester / quantifytools
- Overview
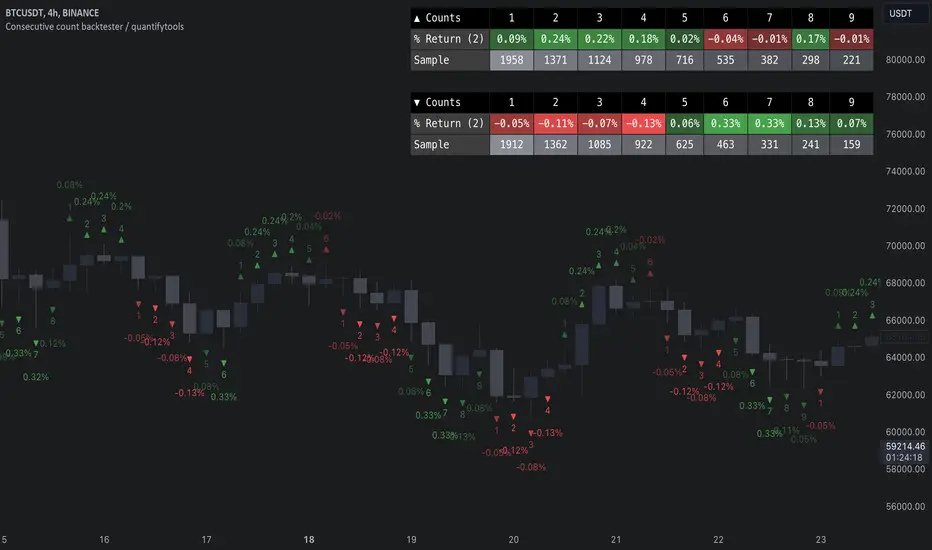
Consecutive counting is a simple method to mechanically define trending states to the upside and downside. Consecutive counts are calculated by taking reference price level (e.g. close 4 candles ago) and count closes above/below it up to a maximum count that resets the consecutive count back to 1. This tool provides the means to backtest each count by measuring % change in price after each count (e.g. % gain 2 candles after a given count).

Users can define reference source that starts the consecutive count (e.g. close 4 candles ago), maximum count where counter resets (e.g. after 9th count) and backtesting period (e.g. price change 2 candles after count).

Filters add extra conditions that must be met on the consecutive count to qualify as valid, which are also reflected on the backtest metrics. The counts can be refined using the following filters:
- RSI above/below X
- Price above/below/at moving average of choice
- Relative volume above/below X

Average gain corresponding to each count as they occur can be toggled off for less clutter. Average price change can also be visualized using candle color. Colors, gradient and table/label sizes are fully customizable.

- Practical guide
Example #1: Identify reversal potential
Consecutive counting is a simple yet effective method to for detecting reversals, for which 7-9 counts are traditionally used. Whether that holds true or not can now be put through a test with different variations of the method as well as using additional filters to improve the probability of a turn.


Example #2: Identify trend following potential
Consecutive counts can also have utility value for trend following. When historical short term change is to the downside, expect downside, when to the upside, expect upside.

Consecutive counting is a simple method to mechanically define trending states to the upside and downside. Consecutive counts are calculated by taking reference price level (e.g. close 4 candles ago) and count closes above/below it up to a maximum count that resets the consecutive count back to 1. This tool provides the means to backtest each count by measuring % change in price after each count (e.g. % gain 2 candles after a given count).
Users can define reference source that starts the consecutive count (e.g. close 4 candles ago), maximum count where counter resets (e.g. after 9th count) and backtesting period (e.g. price change 2 candles after count).
Filters add extra conditions that must be met on the consecutive count to qualify as valid, which are also reflected on the backtest metrics. The counts can be refined using the following filters:
- RSI above/below X
- Price above/below/at moving average of choice
- Relative volume above/below X
Average gain corresponding to each count as they occur can be toggled off for less clutter. Average price change can also be visualized using candle color. Colors, gradient and table/label sizes are fully customizable.
- Practical guide
Example #1: Identify reversal potential
Consecutive counting is a simple yet effective method to for detecting reversals, for which 7-9 counts are traditionally used. Whether that holds true or not can now be put through a test with different variations of the method as well as using additional filters to improve the probability of a turn.
Example #2: Identify trend following potential
Consecutive counts can also have utility value for trend following. When historical short term change is to the downside, expect downside, when to the upside, expect upside.
오픈 소스 스크립트
트레이딩뷰의 진정한 정신에 따라, 이 스크립트의 작성자는 이를 오픈소스로 공개하여 트레이더들이 기능을 검토하고 검증할 수 있도록 했습니다. 작성자에게 찬사를 보냅니다! 이 코드는 무료로 사용할 수 있지만, 코드를 재게시하는 경우 하우스 룰이 적용된다는 점을 기억하세요.
See through charts with orderflow.
Spot rekt traders and whales, liquidity pools, unusual volume & backtest it.
Try risk free for 30 days.
Get FlowMap:
flowly.tools
Spot rekt traders and whales, liquidity pools, unusual volume & backtest it.
Try risk free for 30 days.
Get FlowMap:
flowly.tools
면책사항
해당 정보와 게시물은 금융, 투자, 트레이딩 또는 기타 유형의 조언이나 권장 사항으로 간주되지 않으며, 트레이딩뷰에서 제공하거나 보증하는 것이 아닙니다. 자세한 내용은 이용 약관을 참조하세요.