PROTECTED SOURCE SCRIPT
Market Tension Map v2
📊 Market Tension Map v2 — Detailed Description
core concept
market tension map v2 measures market "tension" through a combination of three independent metrics: volatility, volume, and open interest changes. the indicator operates on the compressed spring principle—when the market enters a state of low volatility with high volume and growing OI, it creates "tension" that predicts a potential sharp price movement.
calculation methodology
component 1: volatility score (0-100)
relative volatility is measured through price standard deviation over a specified period. key distinction—inversion: low volatility produces a high score because range compression creates energy for future movement.
component 2: volume score (0-100)
normalization of current volume relative to the period range. high volume during low volatility signals accumulation of positions by large players before a move.
component 3: open interest score (0-100)
evaluation of open interest changes (available only for futures). rising OI confirms new positions entering the market rather than just redistribution of existing ones.
final tension index
arithmetic mean of three components (or two if OI unavailable). values above threshold (default 70) signal spring "compression".
signal types
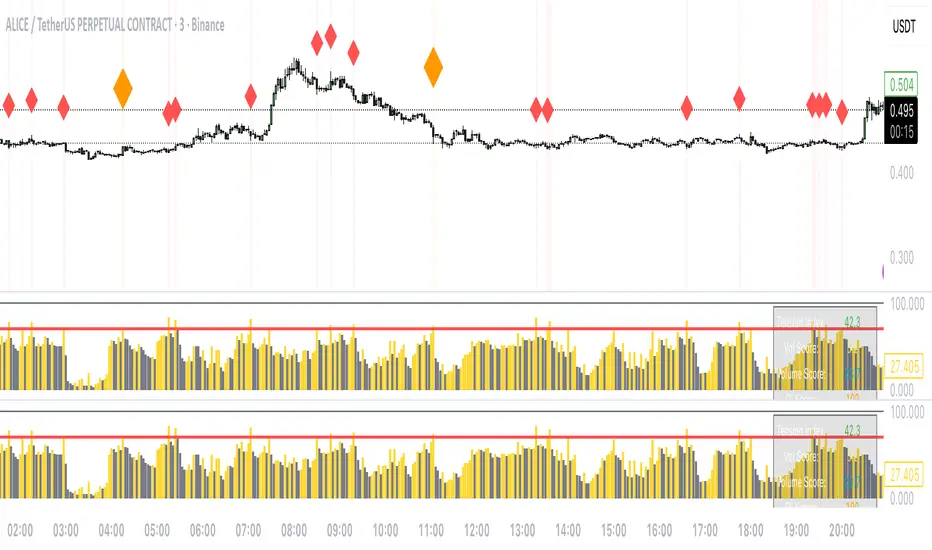
compression signal (🔴 red diamond)
appears when tension index exceeds threshold with normal candle size. this is a predictive signal—market is compressed but explosion hasn't occurred yet. optimal for entry before movement with tight stop.
climax signal (⚠️ orange diamond)
occurs when threshold crossed + large candle (size > ATR × multiplier). this is a reactive signal of culmination—energy already released. often indicates short-term reversal or move exhaustion.
uniqueness of approach
unlike classic compression indicators (bollinger bands squeeze, keltner channels), mtm v2 doesn't rely solely on volatility. adding volume and OI scores creates a multidimensional picture of market microstructure. volatility score inversion is original logic where calm is interpreted as tension.
the algorithm distinguishes two breakout types:
compression without movement (compression)—anticipation trading
compression with large candle (climax)—reversal trading
this separation is absent in standard indicators.
parameter settings
calculation period (20)—normalization window length. lower = more sensitive to short-term changes.
tension threshold (70)—signal activation level. higher = fewer signals but better quality.
atr length (14) + atr multiplier (2.0)—large candle detection parameters for climax signals. increasing multiplier makes filter stricter.
colors and style—full customization of visual elements to adapt to your chart theme.
how to use
main chart: histogram shows current tension level. yellow = rising, gray = falling.
signals on price chart:
red diamond above candle = prepare for entry (compression)
orange diamond = move occurred, watch for reversal (climax)
background highlight: tinted background shows high tension zones.
data table: real-time monitoring of all components + bar status (live/closed).
alerts: configure notifications for compression or climax signals for automatic monitoring.
limitations
open interest available only for futures. for spot markets indicator works with two components.
requires sufficient bar history (>= calculation period) for correct calculations.
on live bar (not closed) values may repaint—use confirmed signals for trading.
recommended timeframes
1h-4h: optimal for swing trading, signals more reliable.
15m-30m: suitable for intraday but requires false breakout filtering.
d: strategic positions, high risk/reward ratio.
license: mozilla public license 2.0
version: pinescript v6
core concept
market tension map v2 measures market "tension" through a combination of three independent metrics: volatility, volume, and open interest changes. the indicator operates on the compressed spring principle—when the market enters a state of low volatility with high volume and growing OI, it creates "tension" that predicts a potential sharp price movement.
calculation methodology
component 1: volatility score (0-100)
relative volatility is measured through price standard deviation over a specified period. key distinction—inversion: low volatility produces a high score because range compression creates energy for future movement.
component 2: volume score (0-100)
normalization of current volume relative to the period range. high volume during low volatility signals accumulation of positions by large players before a move.
component 3: open interest score (0-100)
evaluation of open interest changes (available only for futures). rising OI confirms new positions entering the market rather than just redistribution of existing ones.
final tension index
arithmetic mean of three components (or two if OI unavailable). values above threshold (default 70) signal spring "compression".
signal types
compression signal (🔴 red diamond)
appears when tension index exceeds threshold with normal candle size. this is a predictive signal—market is compressed but explosion hasn't occurred yet. optimal for entry before movement with tight stop.
climax signal (⚠️ orange diamond)
occurs when threshold crossed + large candle (size > ATR × multiplier). this is a reactive signal of culmination—energy already released. often indicates short-term reversal or move exhaustion.
uniqueness of approach
unlike classic compression indicators (bollinger bands squeeze, keltner channels), mtm v2 doesn't rely solely on volatility. adding volume and OI scores creates a multidimensional picture of market microstructure. volatility score inversion is original logic where calm is interpreted as tension.
the algorithm distinguishes two breakout types:
compression without movement (compression)—anticipation trading
compression with large candle (climax)—reversal trading
this separation is absent in standard indicators.
parameter settings
calculation period (20)—normalization window length. lower = more sensitive to short-term changes.
tension threshold (70)—signal activation level. higher = fewer signals but better quality.
atr length (14) + atr multiplier (2.0)—large candle detection parameters for climax signals. increasing multiplier makes filter stricter.
colors and style—full customization of visual elements to adapt to your chart theme.
how to use
main chart: histogram shows current tension level. yellow = rising, gray = falling.
signals on price chart:
red diamond above candle = prepare for entry (compression)
orange diamond = move occurred, watch for reversal (climax)
background highlight: tinted background shows high tension zones.
data table: real-time monitoring of all components + bar status (live/closed).
alerts: configure notifications for compression or climax signals for automatic monitoring.
limitations
open interest available only for futures. for spot markets indicator works with two components.
requires sufficient bar history (>= calculation period) for correct calculations.
on live bar (not closed) values may repaint—use confirmed signals for trading.
recommended timeframes
1h-4h: optimal for swing trading, signals more reliable.
15m-30m: suitable for intraday but requires false breakout filtering.
d: strategic positions, high risk/reward ratio.
license: mozilla public license 2.0
version: pinescript v6
보호된 스크립트입니다
이 스크립트는 비공개 소스로 게시됩니다. 하지만 이를 자유롭게 제한 없이 사용할 수 있습니다 – 자세한 내용은 여기에서 확인하세요.
면책사항
해당 정보와 게시물은 금융, 투자, 트레이딩 또는 기타 유형의 조언이나 권장 사항으로 간주되지 않으며, 트레이딩뷰에서 제공하거나 보증하는 것이 아닙니다. 자세한 내용은 이용 약관을 참조하세요.
보호된 스크립트입니다
이 스크립트는 비공개 소스로 게시됩니다. 하지만 이를 자유롭게 제한 없이 사용할 수 있습니다 – 자세한 내용은 여기에서 확인하세요.
면책사항
해당 정보와 게시물은 금융, 투자, 트레이딩 또는 기타 유형의 조언이나 권장 사항으로 간주되지 않으며, 트레이딩뷰에서 제공하거나 보증하는 것이 아닙니다. 자세한 내용은 이용 약관을 참조하세요.