OPEN-SOURCE SCRIPT
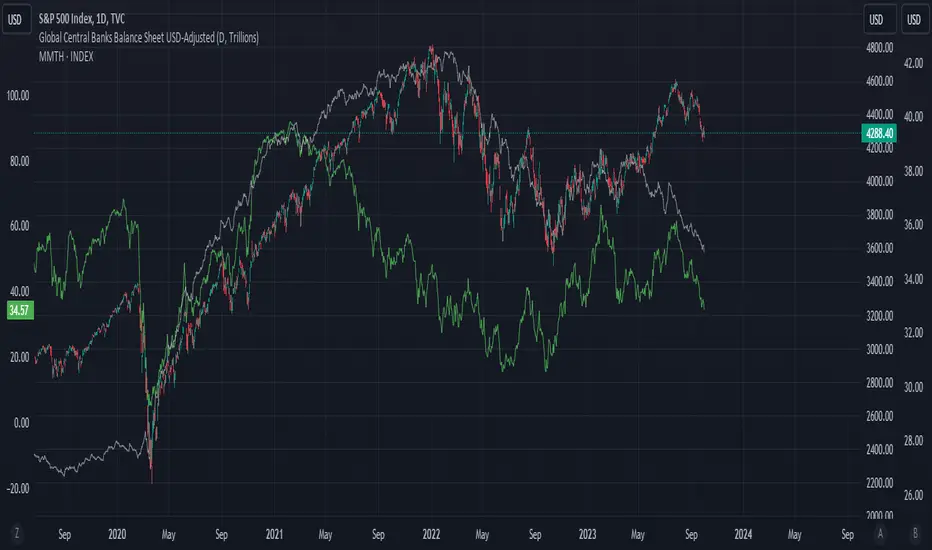
업데이트됨 Global Central Banks Balance Sheet USD-Adjusted

Summing up central banks balance sheet of:
US , China, EU, Japan, UK,
Swiss, Australia, Canada, Norway
Brazil, Russia, India, Mexico, Indonesia
Taiwan, HK, Korea, SG, Thailand
Then adjusting it to USD as the common denominator for comparison.
Net Foreign Assets (or foreign reserves) + Net Domestic Assets (or domestic credit, usually Money Supply M1) = Total Assets of the Central Bank Balance Sheet
In some way, the central bank balance sheet could be M2. However, I find some of the indicators don't add up and I don't have the time to check them out. This indicator is just a proxy. The issue with using central bank balance sheet to determine liquidity in the system is that it doesn't account for 1) collateral used for liquidity management in the public and private system, 2) shadow-banking financial system. As usual, US + EU + Japan publishes their data every weekly and the rest of the central banks publish monthly. I have removed any country with hard-pegged currencies except HK.
Additional materials to aid understanding:
imf.org/-/media/Files/News/Seminars/2017/macroeconomist-training-program-011118/session-2-1.ashx
릴리즈 노트
oreilly.com/library/view/central-bank-balance/9781547400591/content/13_chapter03.xhtmlyardeni.com/pub/balsheetwk.pdf
ECB, Fed and BOJ updates weekly. The rest is monthly or annually.
릴리즈 노트
Changed the intro chart back to SPX vs market breadth vs this indicator릴리즈 노트
-오픈 소스 스크립트
진정한 트레이딩뷰 정신에 따라 이 스크립트 작성자는 트레이더가 기능을 검토하고 검증할 수 있도록 오픈소스로 공개했습니다. 작성자에게 찬사를 보냅니다! 무료로 사용할 수 있지만 코드를 다시 게시할 경우 하우스 룰이 적용된다는 점을 기억하세요.
면책사항
이 정보와 게시물은 TradingView에서 제공하거나 보증하는 금융, 투자, 거래 또는 기타 유형의 조언이나 권고 사항을 의미하거나 구성하지 않습니다. 자세한 내용은 이용 약관을 참고하세요.
오픈 소스 스크립트
진정한 트레이딩뷰 정신에 따라 이 스크립트 작성자는 트레이더가 기능을 검토하고 검증할 수 있도록 오픈소스로 공개했습니다. 작성자에게 찬사를 보냅니다! 무료로 사용할 수 있지만 코드를 다시 게시할 경우 하우스 룰이 적용된다는 점을 기억하세요.
면책사항
이 정보와 게시물은 TradingView에서 제공하거나 보증하는 금융, 투자, 거래 또는 기타 유형의 조언이나 권고 사항을 의미하거나 구성하지 않습니다. 자세한 내용은 이용 약관을 참고하세요.