OPEN-SOURCE SCRIPT
Live off your portofolio (decumulate)
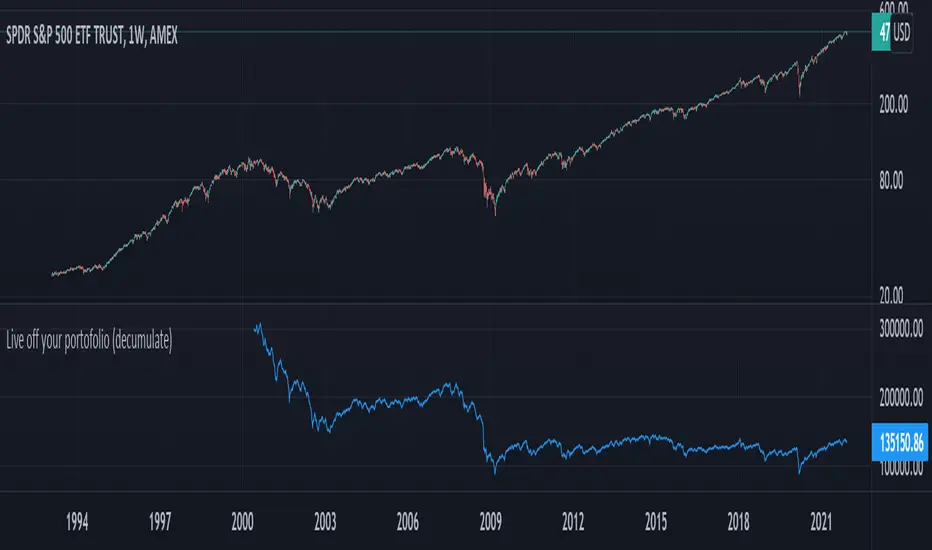
This indicator simulates living off your portofolio consisting of a single security or stock such as the SPY etf or even Bitcoin. The simulation starts at a certain point on the chart (which you input as year and month).
Withrawals from the portofolio are made each month according to the yearly withdrawal rate you enter, such as the 4% SWR. The monthly withdrawal income is calculated in USD at the beginning of the retirement period and then adjusted according to the US inflation (CPI) on 01/01 of each year.
The blue graph represents the USD value of the remaining portofolio.
This indicator is meant to be used on daily, weekly or monthly time frame. It may not work properly (and makes little sense to use) on intraday timeframe or larger time frames such as quarterly (3M).
When withdrawing, the indicator considers that fractional stock values can be used (the portofolio value is kept as a float). This may not be true, as most stock brokers currently don't allow this.
It does not explicitly take into account dividends. In order to do this you will have to enable "Adjust for dividends" by clicking on "adj" in the lower right corner of the screen, or by using the indicator on a Total Return (TR) index such as DAX. Unfortunately SPX does not have dividend data, you will have to use the SPY etf (which doesn't have a long history)
오픈 소스 스크립트
트레이딩뷰의 진정한 정신에 따라, 이 스크립트의 작성자는 이를 오픈소스로 공개하여 트레이더들이 기능을 검토하고 검증할 수 있도록 했습니다. 작성자에게 찬사를 보냅니다! 이 코드는 무료로 사용할 수 있지만, 코드를 재게시하는 경우 하우스 룰이 적용된다는 점을 기억하세요.
면책사항
해당 정보와 게시물은 금융, 투자, 트레이딩 또는 기타 유형의 조언이나 권장 사항으로 간주되지 않으며, 트레이딩뷰에서 제공하거나 보증하는 것이 아닙니다. 자세한 내용은 이용 약관을 참조하세요.
오픈 소스 스크립트
트레이딩뷰의 진정한 정신에 따라, 이 스크립트의 작성자는 이를 오픈소스로 공개하여 트레이더들이 기능을 검토하고 검증할 수 있도록 했습니다. 작성자에게 찬사를 보냅니다! 이 코드는 무료로 사용할 수 있지만, 코드를 재게시하는 경우 하우스 룰이 적용된다는 점을 기억하세요.
면책사항
해당 정보와 게시물은 금융, 투자, 트레이딩 또는 기타 유형의 조언이나 권장 사항으로 간주되지 않으며, 트레이딩뷰에서 제공하거나 보증하는 것이 아닙니다. 자세한 내용은 이용 약관을 참조하세요.