OPEN-SOURCE SCRIPT
업데이트됨 Dual Fibonacci Zones & Ranged Vol DCA Study - R3c0nTrader
What does this do?
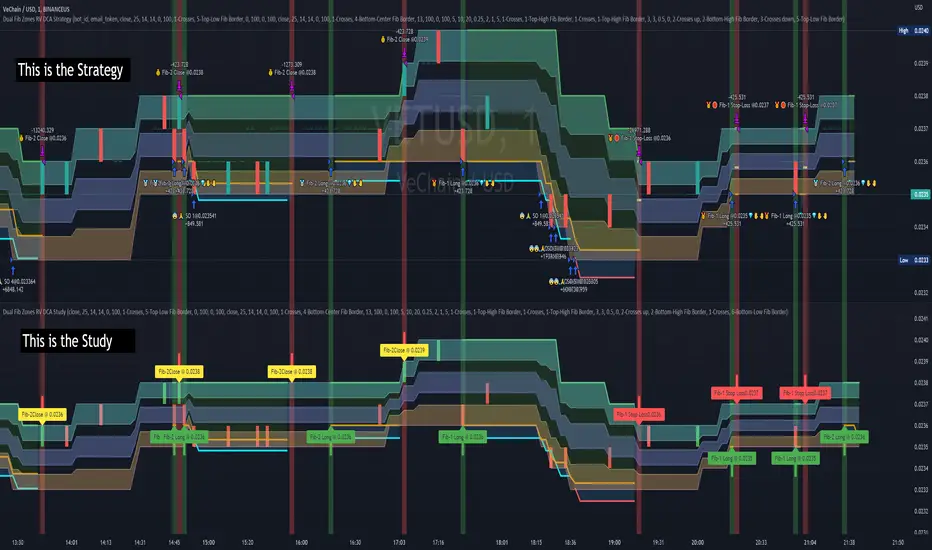
This signal script (aka Study) was created so it could be used with the corresponding strategy "Dual Fibonacci Zone & Ranged Vol DCA Strategy - R3c0nTrader" to create the buy and sell signals for 3Commas bots.
How to Use
Configure the study to match your settings you have set in the strategy. This script comes with an buy and sell alert conditions built-in. Just click to add alert and select Buy or Sell and paste in your bot messages.
Credits:
Thank you "EvoCrypto" for granting me permission to use "Ranged Volume" to create this study
Thank you "eykpunter" for granting me permission to use "Fibonacci Zones" to create this study
릴리즈 노트
Fib Stoploss options were in reverse order when compared to the Entry and Exit options. They now all have the same order for Fib borders.Fixed issue where sometimes the buy and sell arrows not lining up with strategy. Some sells arrows where appearing over the same candles as the buy arrows. Updated the "sell" logic to include a buy_timer check which prevents sells on the same candles as buy signals
릴리즈 노트
Fixed fib-2 zone take profit calculation릴리즈 노트
Fixed issue where sometimes sell arrows not lining up with corresponding strategy when strategy is showing a sell arrow on candle next to a candle with a buy arrow.릴리즈 노트
Added options for specifying the "Min -DI value to open trade" and "Max -DI value to open trade" to both the 1st and 2nd Fibonacci trade entry settings. (Recommend using TradingView's built-in DMI indicator for viewing the +DI and -DI values)릴리즈 노트
Updates:Added option for specifying the "Max ADX value" to both Fib-1 and Fib-2 zone trade entry settings.
Updated several tooltips.
Minor code optimizations and standardizations.
Example of using the Min and Max settings for ADX, +DI, and -DI:
릴리즈 노트
Update:Fixed 'buy' arrow calcution which can cause a buy arrow to flash and not match the strategy.
Example, a paper bot is configured to receive a trading view signal and open a trade when the 'close' price Crosses the "Top-Low" fib border. Here, only the closing price matters and it must be below the "Top-Low" fib border. A low wick down into the "Top-Low" fib border shouldn't count as we specified we want the price to close below the "Top-Low" Fib border
However, before this update, the paper bot could open a trade and this Trading View strategy would show no trade would have happened and the study would show no trade as well. In this example, we can use chart replay to go back to the time the trade was opened and we would see a brief "buy" arrow flash in the study script because the buy condition was temporarily matched.
After this update the "buy" arrow no longer flashes in this example. It would only appear if we change the conditions. Such as setting the source to the "low" price. If that is done, then both the strategy and the study would display an open position and a "buy" arrow.
릴리즈 노트
*New Update*You can now...
1) Customize your buy and sell arrow colors
2) Highlight background color for trades
3) Customize background color for trades
릴리즈 노트
Updates:Fixed issue with Fib-1 strategy's take profit when Fib-2 strategy was enabled.
Fixed issue with Fib-2 strategy's ADX min/max input values not being used correctly.
Cleaned up code.
릴리즈 노트
New Features in this update:1. Added new emojis (as icons) to the Input Menu and Chart for quicker, easier, visual cues (Menu didn't have any visual cues)
a. Fib-1 is the First Place Medal
b. Fib-2 is the Second Place Medal
c. Trailing deviation is the Traffic Light
d. Fib-Based Stop Loss is the Stop sign
e. Take Profit is the money bag
2. Added feature to remove the bar coloring If Ranged Volume is disabled and use standard candle colors instead. The custom Ranged Volume colors will only appear if it is enabled.
3. Added input for Fib-2 trailing deviation. Can now setup 2 different trailing deviations, one for each Fib Zone strategy!
4. Added option for Fib-2 Fib-Stop Loss. Can now setup 2 different Fib-Stob Losses, one for each Fib Zone strategy!
5. When "Trailing Deviation" is used, the following lines will now appear on the chart (these can be disabled in 'Style' Menu):
Original TTP value = White line showing the original target take profit value
Stop Value = Red line which follows the price based on the trailing value and is used to help calculate the trailing stop. If the price moves up, this pushes the yellow Trailing Stop Loss line up.
Trailing Stop Loss = Yellow line showing the trailing stop loss.
6. Updated comments on chart for when the trade closes to include the which Fib strategy was closed (Fib-1 or Fib-2). This makes it easier to see which Fib zone strategy closed, especially for trades that have a long hold time. No longer need to scroll to the beginning of the trade.
Fixed Issues in this update:
1. Fixed issue with Fib-2 strategy using Fib-1's ADX setting
2. Fixed trades not closing according to specified trailing deviation % ; Found trades were closing far later than they should be. Researched new calculation to fix this.
3. Fixed issue where sometimes no trades are shown and only the orange Avg Price line appears.
4. Fixed issue with Sell arrow color option not updating the color.
릴리즈 노트
Fixed issue where if Fib-1 was disabled and Fib-2 was enabled with trailing, the trade would not use Fib-2's trailing settings. Instead it would use Fib-1 settings. Sometimes I miss things when I am updating the code (it is over 700 lines) since I basically do everything by myself, the programming, dev/test, and QA.
If you find an issue, let me know so I can look into it. Thank you.
릴리즈 노트
Added Trailing Deviation icon to menu (was accidentally missed in last update).릴리즈 노트
Fixed issue with Safety Order execution may not match the Strategy in some situations.릴리즈 노트
New Features in this update:
1. Added Labels to the Buys/Sells to show text containing which strategy was used and at what price.
a.
2. Added debugs to the Style Menu (not enabled by default). These debugs are to be used with the built-in "Data Window" in TradingView.
I use these values for troubleshooting and to confirm to the same values found in the strategy.
The new debugs are:
a. Position Size
b. Total Units
c. SO Buy Qty
d. SO Buy Price
e. take_profit_level (the current take profit level of either Fib-1 or Fib-2, whichever is active at the time)
f. take_profit_1 (Fib-1 zone take profit)
g. take_profit_2 (Fib-2 zone take profit)
Fixed Issues in this update:
1. Updated the Fib-Based Stop Loss routine to fix issue where sometimes Fib-2 zone strategy was using Fib-1's Fib-based stop loss.
2. Fixed issue where sometimes the white and red lines for the trailing stop would continue to be drawn past the take profit point.
3. Added code to make sure additional variables are zeroed out after trades are closed to prevent issues with trades not closing when a different strategy opens the next trade (this was a result of adding the above "fix" which was needed)
오픈 소스 스크립트
트레이딩뷰의 진정한 정신에 따라, 이 스크립트의 작성자는 이를 오픈소스로 공개하여 트레이더들이 기능을 검토하고 검증할 수 있도록 했습니다. 작성자에게 찬사를 보냅니다! 이 코드는 무료로 사용할 수 있지만, 코드를 재게시하는 경우 하우스 룰이 적용된다는 점을 기억하세요.
면책사항
해당 정보와 게시물은 금융, 투자, 트레이딩 또는 기타 유형의 조언이나 권장 사항으로 간주되지 않으며, 트레이딩뷰에서 제공하거나 보증하는 것이 아닙니다. 자세한 내용은 이용 약관을 참조하세요.
오픈 소스 스크립트
트레이딩뷰의 진정한 정신에 따라, 이 스크립트의 작성자는 이를 오픈소스로 공개하여 트레이더들이 기능을 검토하고 검증할 수 있도록 했습니다. 작성자에게 찬사를 보냅니다! 이 코드는 무료로 사용할 수 있지만, 코드를 재게시하는 경우 하우스 룰이 적용된다는 점을 기억하세요.
면책사항
해당 정보와 게시물은 금융, 투자, 트레이딩 또는 기타 유형의 조언이나 권장 사항으로 간주되지 않으며, 트레이딩뷰에서 제공하거나 보증하는 것이 아닙니다. 자세한 내용은 이용 약관을 참조하세요.