OPEN-SOURCE SCRIPT
업데이트됨 Extended Parallel Channels
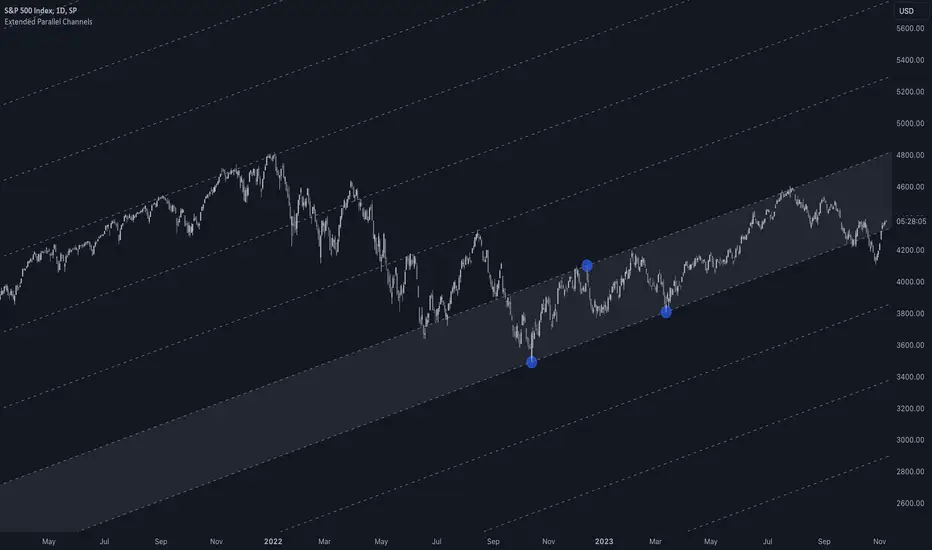
This indicator provides an enhanced version of the popular Parallel Channel tool by allowing channel boundaries to be extended above and below the primary channel. It can also serve as a general tool for drawing parallel lines and grid lines to aid technical analysis.
🟠 Application
There are two primary ways extended channels can provide valuable insights:
🔵 Support and Resistance Levels
When prices break out of a channel, they often encounter strong resistance at approximately the 100% extension point. Breakout traders can utilize the extended channel boundary to place take-profit orders. Meanwhile, reversal traders can look for entry opportunities at this level.

🔵 Grid / Martingale Trading
Grid Trading and Martingale Trading strategies rely heavily on grid lines. This indicator streamlines that process by enabling traders to effortlessly plot grid lines across the chart.
🟠 Instructions
Upon adding the indicator, the user will be prompted to set the channel boundaries by placing three anchor points on the chart. The first two anchors determine one boundary line, while the third anchor determine the other boundary line.
Once the three anchors are positioned, the indicator automatically plots the resulting channel as well as the extended lines. The anchor points are highlighted as movable blue circles, allowing the user to dynamically adjust the channel formation by dragging the anchors to new locations as needed.
🟠 Application
There are two primary ways extended channels can provide valuable insights:
🔵 Support and Resistance Levels
When prices break out of a channel, they often encounter strong resistance at approximately the 100% extension point. Breakout traders can utilize the extended channel boundary to place take-profit orders. Meanwhile, reversal traders can look for entry opportunities at this level.
🔵 Grid / Martingale Trading
Grid Trading and Martingale Trading strategies rely heavily on grid lines. This indicator streamlines that process by enabling traders to effortlessly plot grid lines across the chart.
🟠 Instructions
Upon adding the indicator, the user will be prompted to set the channel boundaries by placing three anchor points on the chart. The first two anchors determine one boundary line, while the third anchor determine the other boundary line.
Once the three anchors are positioned, the indicator automatically plots the resulting channel as well as the extended lines. The anchor points are highlighted as movable blue circles, allowing the user to dynamically adjust the channel formation by dragging the anchors to new locations as needed.
릴리즈 노트
Added support for retaining the same channels when switching the chart to a higher timeframe.오픈 소스 스크립트
트레이딩뷰의 진정한 정신에 따라, 이 스크립트의 작성자는 이를 오픈소스로 공개하여 트레이더들이 기능을 검토하고 검증할 수 있도록 했습니다. 작성자에게 찬사를 보냅니다! 이 코드는 무료로 사용할 수 있지만, 코드를 재게시하는 경우 하우스 룰이 적용된다는 점을 기억하세요.
专业缠论指标: alphaviz.pro/chanlun
Email: contact@alphaviz.pro
Discord: discord.gg/w2fFtNega4
Email: contact@alphaviz.pro
Discord: discord.gg/w2fFtNega4
면책사항
해당 정보와 게시물은 금융, 투자, 트레이딩 또는 기타 유형의 조언이나 권장 사항으로 간주되지 않으며, 트레이딩뷰에서 제공하거나 보증하는 것이 아닙니다. 자세한 내용은 이용 약관을 참조하세요.
오픈 소스 스크립트
트레이딩뷰의 진정한 정신에 따라, 이 스크립트의 작성자는 이를 오픈소스로 공개하여 트레이더들이 기능을 검토하고 검증할 수 있도록 했습니다. 작성자에게 찬사를 보냅니다! 이 코드는 무료로 사용할 수 있지만, 코드를 재게시하는 경우 하우스 룰이 적용된다는 점을 기억하세요.
专业缠论指标: alphaviz.pro/chanlun
Email: contact@alphaviz.pro
Discord: discord.gg/w2fFtNega4
Email: contact@alphaviz.pro
Discord: discord.gg/w2fFtNega4
면책사항
해당 정보와 게시물은 금융, 투자, 트레이딩 또는 기타 유형의 조언이나 권장 사항으로 간주되지 않으며, 트레이딩뷰에서 제공하거나 보증하는 것이 아닙니다. 자세한 내용은 이용 약관을 참조하세요.