OPEN-SOURCE SCRIPT
Market Regime Detector
Market Regime Detector
The Market Regime Detector is a tool designed to help traders identify and adapt to the prevailing market environment by analyzing price action in relation to key macro timeframe levels. This indicator categorizes the market into distinct regimes—Bullish, Bearish, or Reverting—providing actionable insights to set trading expectations, manage volatility, and align strategies with broader market conditions.
What is a Market Regime?
A market regime refers to the overarching state or condition of the market at a given time. Understanding the market regime is critical for traders as it determines the most effective trading approach. The three main regimes are:
Bullish Regime:
Characterized by upward momentum where prices are consistently trending higher.
Trading strategies often focus on buying opportunities and trend-following setups.
Bearish Regime:
Defined by downward price pressure and declining trends.
Traders typically look for selling opportunities or adopt risk-off strategies.
Reverting Regime:
Represents a consolidation phase where prices move within a defined range.
Ideal for mean-reversion strategies or range-bound trading setups.
Key Features of the Market Regime Detector:
Dynamic Market Regime Detection:
Identifies the market regime based on macro timeframe high and low levels (e.g., weekly or monthly).
Provides clear and actionable insights for each regime to align trading strategies.
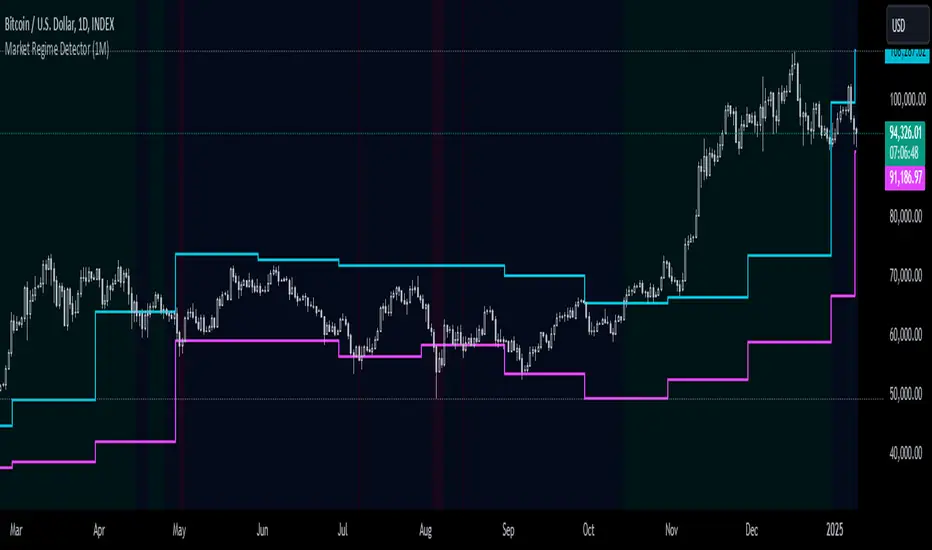
Visual Context for Price Levels:
Plots the macro high and low levels on the chart, allowing traders to visualize critical support and resistance zones.
Enhances understanding of volatility and trend boundaries.
Regime Transition Alerts:
Sends alerts only when the market transitions into a new regime, ensuring traders are notified of meaningful changes without redundant signals.
Alert messages include clear regime descriptions, such as "Market entered a Bullish Regime: Price is above the macro high."
Customizable Visualization:
Background colors dynamically adjust to the current regime:
Blue for Reverting.
Aqua for Bullish.
Fuchsia for Bearish.
Option to toggle high/low line plotting and background highlights for a tailored experience.
Volatility and Expectation Management:
Offers insights into market volatility by showing when price action approaches, exceeds, or reverts within macro timeframe levels.
Helps traders set realistic expectations and adjust their strategies accordingly.
Use Cases:
Trend Traders: Identify bullish or bearish regimes to capture sustained price movements.
Range Traders: Leverage reverting regimes to trade between defined support and resistance zones.
Risk Managers: Use macro high and low levels as dynamic stop-loss or take-profit zones to optimize trade management.
The Market Regime Detector equips traders with a deeper understanding of the market environment, making it an essential tool for informed decision-making and strategic planning. Whether you're trading trends, ranges, or managing risk, this indicator provides the clarity and insights needed to navigate any market condition.
The Market Regime Detector is a tool designed to help traders identify and adapt to the prevailing market environment by analyzing price action in relation to key macro timeframe levels. This indicator categorizes the market into distinct regimes—Bullish, Bearish, or Reverting—providing actionable insights to set trading expectations, manage volatility, and align strategies with broader market conditions.
What is a Market Regime?
A market regime refers to the overarching state or condition of the market at a given time. Understanding the market regime is critical for traders as it determines the most effective trading approach. The three main regimes are:
Bullish Regime:
Characterized by upward momentum where prices are consistently trending higher.
Trading strategies often focus on buying opportunities and trend-following setups.
Bearish Regime:
Defined by downward price pressure and declining trends.
Traders typically look for selling opportunities or adopt risk-off strategies.
Reverting Regime:
Represents a consolidation phase where prices move within a defined range.
Ideal for mean-reversion strategies or range-bound trading setups.
Key Features of the Market Regime Detector:
Dynamic Market Regime Detection:
Identifies the market regime based on macro timeframe high and low levels (e.g., weekly or monthly).
Provides clear and actionable insights for each regime to align trading strategies.
Visual Context for Price Levels:
Plots the macro high and low levels on the chart, allowing traders to visualize critical support and resistance zones.
Enhances understanding of volatility and trend boundaries.
Regime Transition Alerts:
Sends alerts only when the market transitions into a new regime, ensuring traders are notified of meaningful changes without redundant signals.
Alert messages include clear regime descriptions, such as "Market entered a Bullish Regime: Price is above the macro high."
Customizable Visualization:
Background colors dynamically adjust to the current regime:
Blue for Reverting.
Aqua for Bullish.
Fuchsia for Bearish.
Option to toggle high/low line plotting and background highlights for a tailored experience.
Volatility and Expectation Management:
Offers insights into market volatility by showing when price action approaches, exceeds, or reverts within macro timeframe levels.
Helps traders set realistic expectations and adjust their strategies accordingly.
Use Cases:
Trend Traders: Identify bullish or bearish regimes to capture sustained price movements.
Range Traders: Leverage reverting regimes to trade between defined support and resistance zones.
Risk Managers: Use macro high and low levels as dynamic stop-loss or take-profit zones to optimize trade management.
The Market Regime Detector equips traders with a deeper understanding of the market environment, making it an essential tool for informed decision-making and strategic planning. Whether you're trading trends, ranges, or managing risk, this indicator provides the clarity and insights needed to navigate any market condition.
오픈 소스 스크립트
트레이딩뷰의 진정한 정신에 따라, 이 스크립트의 작성자는 이를 오픈소스로 공개하여 트레이더들이 기능을 검토하고 검증할 수 있도록 했습니다. 작성자에게 찬사를 보냅니다! 이 코드는 무료로 사용할 수 있지만, 코드를 재게시하는 경우 하우스 룰이 적용된다는 점을 기억하세요.
면책사항
해당 정보와 게시물은 금융, 투자, 트레이딩 또는 기타 유형의 조언이나 권장 사항으로 간주되지 않으며, 트레이딩뷰에서 제공하거나 보증하는 것이 아닙니다. 자세한 내용은 이용 약관을 참조하세요.
오픈 소스 스크립트
트레이딩뷰의 진정한 정신에 따라, 이 스크립트의 작성자는 이를 오픈소스로 공개하여 트레이더들이 기능을 검토하고 검증할 수 있도록 했습니다. 작성자에게 찬사를 보냅니다! 이 코드는 무료로 사용할 수 있지만, 코드를 재게시하는 경우 하우스 룰이 적용된다는 점을 기억하세요.
면책사항
해당 정보와 게시물은 금융, 투자, 트레이딩 또는 기타 유형의 조언이나 권장 사항으로 간주되지 않으며, 트레이딩뷰에서 제공하거나 보증하는 것이 아닙니다. 자세한 내용은 이용 약관을 참조하세요.