INVITE-ONLY SCRIPT
SVX (Sentiment Velocity Index) EMA & Slope Structure
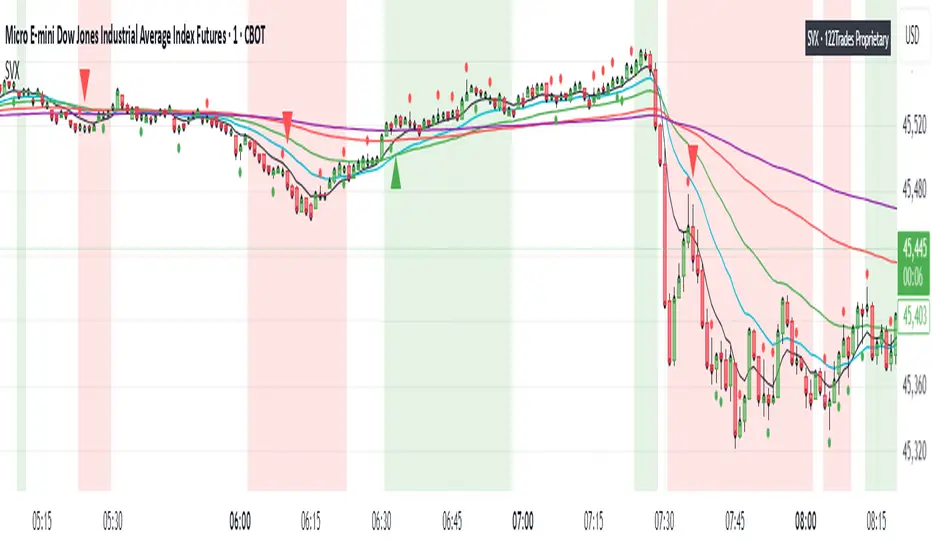
The SVX Momentum Framework is designed as a momentum and slope visualization tool. Designed to identify momentum shifts and pre-move conditions within price action.
What it draws:
- Plots five EMAs (8, 20, 40, 100, 200) To visualize short/medium trend structure. You can pick which ones to see.
- Calculates an EMA-based slope (rate of change) from actual closing-price movement and colors a neutral/positive/negative background for context. This is not ATR or Supertrend.
- Shows optional triangle context markers on bars that meet wick/body conditions that often precede momentum transitions (off by default / user-controlled).
- Shows Reference close (optional): Use when you need to verify price relative to standard closes for easier zone and level marking.
How the components work together:
- The EMA stack provides directional alignment (compression/expansion and relative order of 8/20/40/100/200).
- The slope quantifies whether recent movement is neutral, building (Green), or fading (Red); the background simply reflects that state.
- The triangle context markers flag a bar-shape condition (wick/body relationship) that can precede changes in behavior.
- The reference close is a visual aid for clarity when users compare candle closes and trading zones or levels .
How to read it:
- Structure: Look for EMA ordering (at least 8/20/100 recommended) and spacing to understand the underlying bias and compression/expansion.
- Slope state: Neutral (no bias, white), positive (building, green), or negative (fading, red). Use it as context, not as entries/exits.
- Context markers (optional): Treat them as visual highlights.
- Reference close (optional): Use when you need to verify price relative to candle close for easier zone and level marking.
How to use it (general guidance):
- Read structure first (EMA order/spread), then consider the slope state to understand whether conditions are neutral or possibly momentum-driven in the indicated direction.
- Combine with your own entry rules and/or engulfing candle patterns for timing, risk, and apply your preferred management.
What’s original here:
- The slope visualization is derived from actual closing-price movement, not Supertrend or ATR overlays.
- The wick/body context markers focus on bars that often precede transitions, presented as optional visuals.
- The reference close overlay is included purely to aid interpretation when comparing views to the native close and for more clear zone and level marking.
Access & intent:
- Educational visualization of structure and slope, providing a framework traders can build upon.
- The author does not provide financial advice. Use at your own discretion.
Disclaimer
This script is provided for educational and informational purposes only. It does not constitute financial advice, investment recommendations, or a solicitation to trade. Past performance is not indicative of future results. The author assumes no responsibility for losses incurred from the use of this tool. TradingView, Inc. has no liability related to this script or its use.
초대 전용 스크립트
이 스크립트는 작성자가 승인한 사용자만 접근할 수 있습니다. 사용하려면 요청 후 승인을 받아야 하며, 일반적으로 결제 후에 허가가 부여됩니다. 자세한 내용은 아래 작성자의 안내를 따르거나 One_To_Two_Trades에게 직접 문의하세요.
트레이딩뷰는 스크립트의 작동 방식을 충분히 이해하고 작성자를 완전히 신뢰하지 않는 이상, 해당 스크립트에 비용을 지불하거나 사용하는 것을 권장하지 않습니다. 커뮤니티 스크립트에서 무료 오픈소스 대안을 찾아보실 수도 있습니다.
작성자 지시 사항
For more information please contact Support@122Trades.com
122Trades
면책사항
해당 정보와 게시물은 금융, 투자, 트레이딩 또는 기타 유형의 조언이나 권장 사항으로 간주되지 않으며, 트레이딩뷰에서 제공하거나 보증하는 것이 아닙니다. 자세한 내용은 이용 약관을 참조하세요.