OPEN-SOURCE SCRIPT
업데이트됨 JSun - Guppy Multiple Moving AverAge
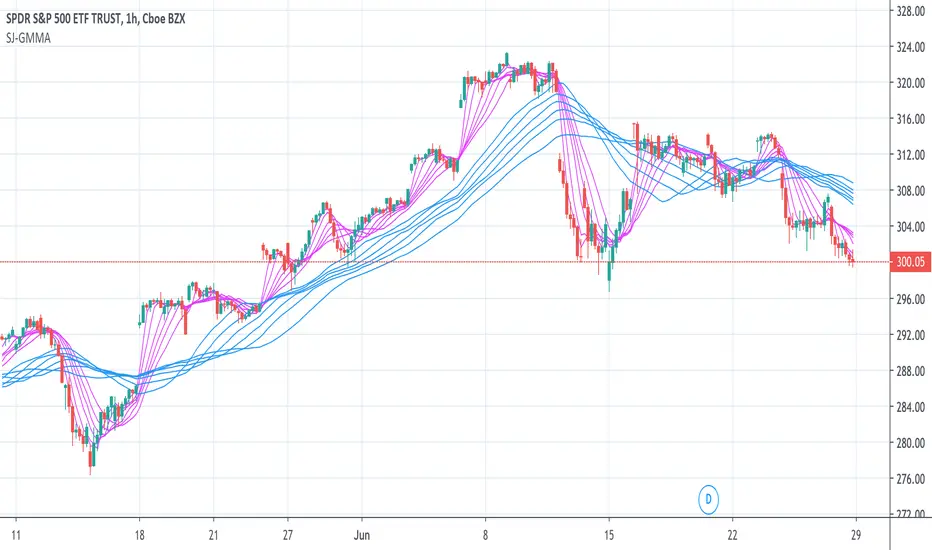
The Guppy Multiple Moving Average (GMMA) is a technical indicator that identifies changing trends, breakouts, and trading opportunities in the price of an asset by combining two groups of moving averages (MA) with different time periods. There is a short-term group of MAs, and a long-term group of MA. Both contain six MAs, for a total of 12. The term gets its name from Daryl Guppy, an Australian trader who is credited with its development.
Key Takeaways:
1. The Gruppy Multiple Moving Average (GMMA) is applied as an overlay on the price chart of an asset.
2. The short-term MAs are typically set at 3, 5, 8, 10, 12, and 15 periods. The longer-term MAs are typically set at 30, 35, 40, 45, 50, and 60.
3. When the short-term group of averages moves above the longer-term group, it indicates a price uptrend in the asset could be emerging.
4. When the short-term group falls below the longer-term group of MAs, a price downtrend in the asset could be starting.
5. When there is lots of separation between the MAs, this helps confirm the price trend in the current direction.
6. If both groups become compressed with each other, or crisscross, it indicates the price has paused and a price trend reversal is possible.
7. Traders often trade in the direction the longer-term MA group is moving, and use the short-term group for trade signals to enter or exit.
릴리즈 노트
Jun.28, 2020 Changed Some Comments오픈 소스 스크립트
트레이딩뷰의 진정한 정신에 따라, 이 스크립트의 작성자는 이를 오픈소스로 공개하여 트레이더들이 기능을 검토하고 검증할 수 있도록 했습니다. 작성자에게 찬사를 보냅니다! 이 코드는 무료로 사용할 수 있지만, 코드를 재게시하는 경우 하우스 룰이 적용된다는 점을 기억하세요.
면책사항
해당 정보와 게시물은 금융, 투자, 트레이딩 또는 기타 유형의 조언이나 권장 사항으로 간주되지 않으며, 트레이딩뷰에서 제공하거나 보증하는 것이 아닙니다. 자세한 내용은 이용 약관을 참조하세요.
오픈 소스 스크립트
트레이딩뷰의 진정한 정신에 따라, 이 스크립트의 작성자는 이를 오픈소스로 공개하여 트레이더들이 기능을 검토하고 검증할 수 있도록 했습니다. 작성자에게 찬사를 보냅니다! 이 코드는 무료로 사용할 수 있지만, 코드를 재게시하는 경우 하우스 룰이 적용된다는 점을 기억하세요.
면책사항
해당 정보와 게시물은 금융, 투자, 트레이딩 또는 기타 유형의 조언이나 권장 사항으로 간주되지 않으며, 트레이딩뷰에서 제공하거나 보증하는 것이 아닙니다. 자세한 내용은 이용 약관을 참조하세요.