PROTECTED SOURCE SCRIPT
업데이트됨 Machine Learning RSI Bands
"Machine Learning RSI Bands" Indicator
The "Machine Learning RSI Bands" (MLRSIB) indicator leverages advanced algorithmic analysis to enhance traditional RSI strategies:
RSI Customization: Users can customize the RSI settings including source, length, and thresholds for overbought/oversold conditions.
Innovative Machine Learning Application: The script uses a proprietary function FOUNDATION_400x10x2 from the 'FOUNDATION' library, which analyzes the last 400 occurrences of data points, considering various market dynamics like volume changes or RSI movements based on the selected sampling method. Outputs four optimal outcomes for both upper and lower band conditions, representing the most statistically significant patterns or predictions.
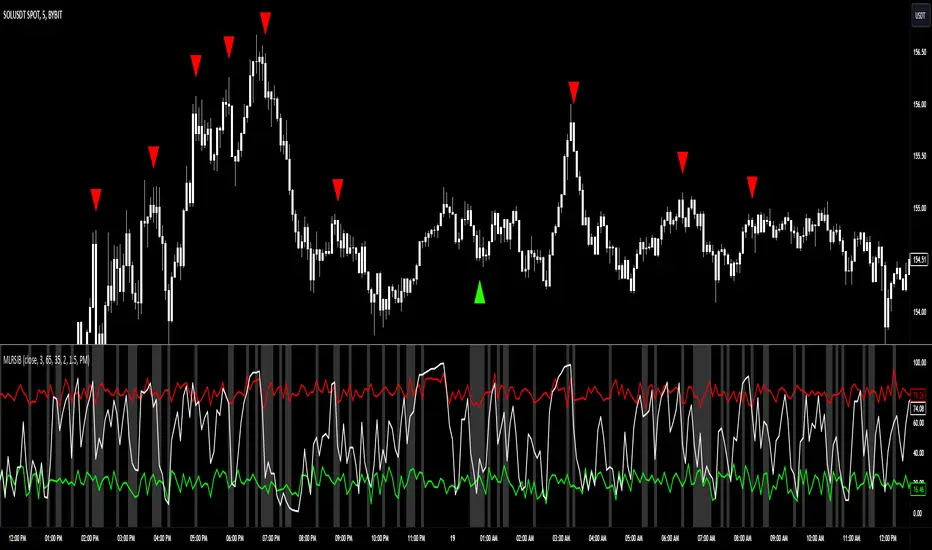
Dynamic Band Visualization: Plots the average of these four outcomes as colored lines (red for the upper band, green for the lower band) on the chart, serving as dynamic support and resistance or overbought/oversold levels.
Signal Plotting: Displays triangles above or below the bars to signal potential short or long entries when the RSI crosses these machine learning-adjusted bands under certain confidence conditions.
Market Volatility Indicator: Adjusts the chart's background color based on volatility, using an average deviation analysis to gauge market calmness or agitation.
Alert System: Provides alert conditions for when these sophisticated signals are triggered, allowing for timely trading actions.
This indicator is designed for traders interested in combining traditional technical analysis with machine learning to refine their market entry and exit strategies, focusing on patterns identified from recent market behavior.
The "Machine Learning RSI Bands" (MLRSIB) indicator leverages advanced algorithmic analysis to enhance traditional RSI strategies:
RSI Customization: Users can customize the RSI settings including source, length, and thresholds for overbought/oversold conditions.
Innovative Machine Learning Application: The script uses a proprietary function FOUNDATION_400x10x2 from the 'FOUNDATION' library, which analyzes the last 400 occurrences of data points, considering various market dynamics like volume changes or RSI movements based on the selected sampling method. Outputs four optimal outcomes for both upper and lower band conditions, representing the most statistically significant patterns or predictions.
Dynamic Band Visualization: Plots the average of these four outcomes as colored lines (red for the upper band, green for the lower band) on the chart, serving as dynamic support and resistance or overbought/oversold levels.
Signal Plotting: Displays triangles above or below the bars to signal potential short or long entries when the RSI crosses these machine learning-adjusted bands under certain confidence conditions.
Market Volatility Indicator: Adjusts the chart's background color based on volatility, using an average deviation analysis to gauge market calmness or agitation.
Alert System: Provides alert conditions for when these sophisticated signals are triggered, allowing for timely trading actions.
This indicator is designed for traders interested in combining traditional technical analysis with machine learning to refine their market entry and exit strategies, focusing on patterns identified from recent market behavior.
릴리즈 노트
Input Reorder릴리즈 노트
Updated Confidence Reasoning보호된 스크립트입니다
이 스크립트는 비공개 소스로 게시됩니다. 하지만 이를 자유롭게 제한 없이 사용할 수 있습니다 – 자세한 내용은 여기에서 확인하세요.
면책사항
해당 정보와 게시물은 금융, 투자, 트레이딩 또는 기타 유형의 조언이나 권장 사항으로 간주되지 않으며, 트레이딩뷰에서 제공하거나 보증하는 것이 아닙니다. 자세한 내용은 이용 약관을 참조하세요.
면책사항
해당 정보와 게시물은 금융, 투자, 트레이딩 또는 기타 유형의 조언이나 권장 사항으로 간주되지 않으며, 트레이딩뷰에서 제공하거나 보증하는 것이 아닙니다. 자세한 내용은 이용 약관을 참조하세요.