PROTECTED SOURCE SCRIPT
업데이트됨 Lite Trading Diary : equity curve
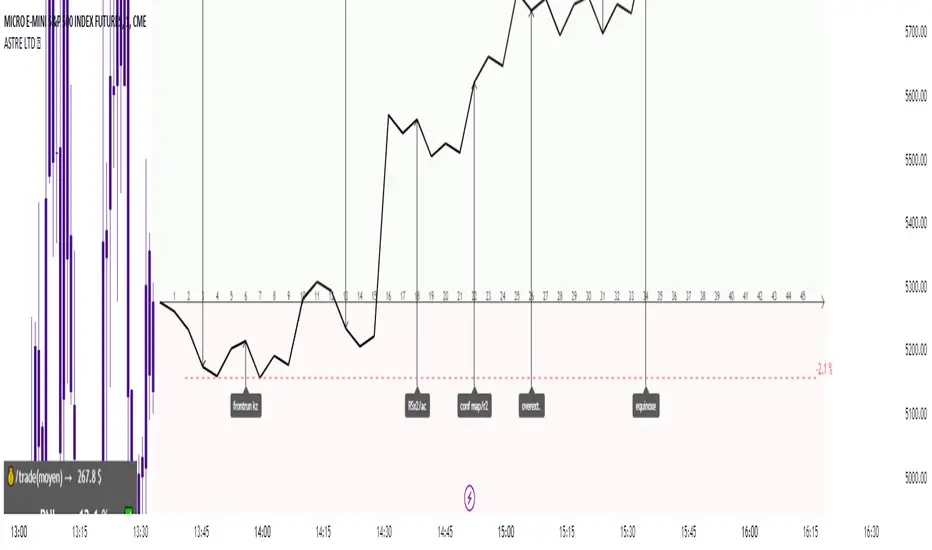
Dynamic trading journal with equity curve display. Detailed results with prop firm objectives, editable, $/month estimation, possibility to compare two strategies.
one line in parameter = one trade.
For each trade, specify : RR (Win, or "-1" for a stoploss), type of trade, and a comment.
The bottom left table summarizes the overall performance with some key information. RA return => Risk adjusted performance.
there is the possibility to define a "Type" : type 1, 2 or 3. It allows to split the equity curve. You can thus distinguish the different sub-strategies of your strategy, visually see their effectiveness, and be able to adjust your risk exposure accordingly.
Learn from your backtests. Identify your strengths, your weaknesses, and improve!
All the conditions to succeed in the challenge are adjustable in the parameters. Please note : drawdown on the equity curve is max drawdown. On the table => static drawdown.
Use "A random day trading" indicator to spice up your training.
I hope this will be useful for you to track your performance !
릴리즈 노트
fix picture보호된 스크립트입니다
이 스크립트는 비공개 소스로 게시됩니다. 하지만 이를 자유롭게 제한 없이 사용할 수 있습니다 – 자세한 내용은 여기에서 확인하세요.
Most aggressive TradingView/MT4/MT5 trading setup on the market. Pure juice concentrated from SMC/ICT, divergences and PA!
Snipe the institutional levels! 🐋🏹
Snipe the institutional levels! 🐋🏹
면책사항
해당 정보와 게시물은 금융, 투자, 트레이딩 또는 기타 유형의 조언이나 권장 사항으로 간주되지 않으며, 트레이딩뷰에서 제공하거나 보증하는 것이 아닙니다. 자세한 내용은 이용 약관을 참조하세요.
보호된 스크립트입니다
이 스크립트는 비공개 소스로 게시됩니다. 하지만 이를 자유롭게 제한 없이 사용할 수 있습니다 – 자세한 내용은 여기에서 확인하세요.
Most aggressive TradingView/MT4/MT5 trading setup on the market. Pure juice concentrated from SMC/ICT, divergences and PA!
Snipe the institutional levels! 🐋🏹
Snipe the institutional levels! 🐋🏹
면책사항
해당 정보와 게시물은 금융, 투자, 트레이딩 또는 기타 유형의 조언이나 권장 사항으로 간주되지 않으며, 트레이딩뷰에서 제공하거나 보증하는 것이 아닙니다. 자세한 내용은 이용 약관을 참조하세요.