OPEN-SOURCE SCRIPT
Elder AutoEnvelope with Overbought/Oversold Levels with Labels
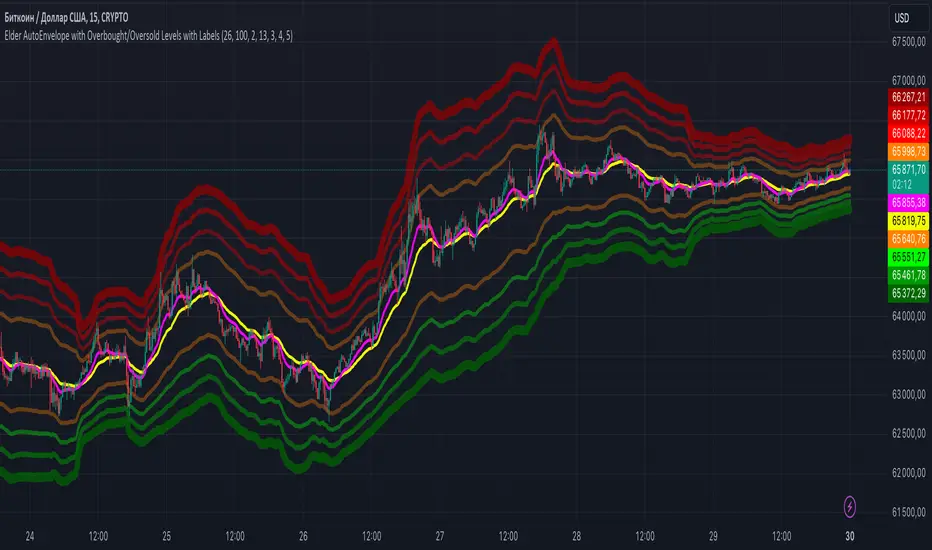
The **"Elder AutoEnvelope with Overbought/Oversold Levels with Labels"** is a technical analysis tool designed to help identify overbought and oversold levels in the market, as well as potential reversal points. It uses moving averages and price volatility to detect possible price extremes.
### Indicator Description:
- **Center EMA (26)**: Acts as the main trend line.
- **Envelope Channels**: These are constructed around the central EMA using the current price volatility. The main channel lines are determined by multiplying the standard deviation of the price by the chosen multiplier.
- **Additional Overbought/Oversold Levels**: Displayed on the chart with different colors and thicknesses to highlight small, moderate, strong, and very strong levels.
- **Labels**: Show specific levels when the price reaches areas of overbought or oversold conditions.
### How to Apply in Practice:
1. **Identifying Extremes**: The indicator shows areas where the price is considered overbought or oversold relative to the current trend. When the price touches or exceeds these levels, it can indicate a potential reversal or correction.
2. **Entry/Exit Signals**:
- **Entry on Oversold**: If the price reaches the lower Envelope lines (especially at strong or very strong oversold levels), it may be a good buying signal.
- **Exit on Overbought**: If the price touches the upper lines (especially at strong or very strong overbought levels), it signals a potential selling opportunity.
3. **Combining with Other Indicators**: It’s recommended to use this indicator alongside oscillators like RSI or MACD for signal confirmation.
4. **Trend Analysis**: The central EMA (26) helps identify the trend direction. If the price is above it, the trend is considered bullish; if below, bearish.
This indicator is particularly useful in volatile markets and helps detect price movements near highs or lows.
오픈 소스 스크립트
트레이딩뷰의 진정한 정신에 따라, 이 스크립트의 작성자는 이를 오픈소스로 공개하여 트레이더들이 기능을 검토하고 검증할 수 있도록 했습니다. 작성자에게 찬사를 보냅니다! 이 코드는 무료로 사용할 수 있지만, 코드를 재게시하는 경우 하우스 룰이 적용된다는 점을 기억하세요.
면책사항
해당 정보와 게시물은 금융, 투자, 트레이딩 또는 기타 유형의 조언이나 권장 사항으로 간주되지 않으며, 트레이딩뷰에서 제공하거나 보증하는 것이 아닙니다. 자세한 내용은 이용 약관을 참조하세요.
오픈 소스 스크립트
트레이딩뷰의 진정한 정신에 따라, 이 스크립트의 작성자는 이를 오픈소스로 공개하여 트레이더들이 기능을 검토하고 검증할 수 있도록 했습니다. 작성자에게 찬사를 보냅니다! 이 코드는 무료로 사용할 수 있지만, 코드를 재게시하는 경우 하우스 룰이 적용된다는 점을 기억하세요.
면책사항
해당 정보와 게시물은 금융, 투자, 트레이딩 또는 기타 유형의 조언이나 권장 사항으로 간주되지 않으며, 트레이딩뷰에서 제공하거나 보증하는 것이 아닙니다. 자세한 내용은 이용 약관을 참조하세요.