OPEN-SOURCE SCRIPT
bows
//version=5
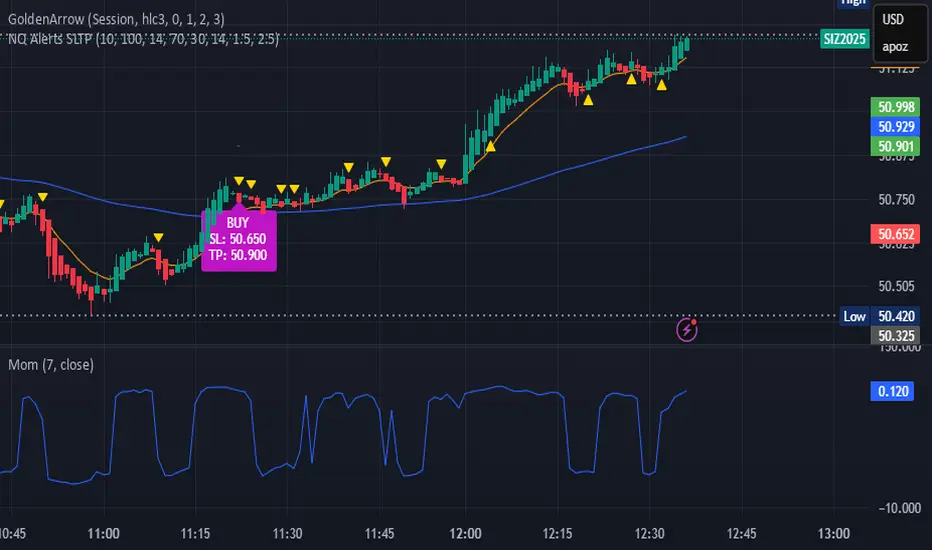
indicator("NQ EMA+RSI+ATR Alerts with SL/TP", overlay=true, shorttitle="NQ Alerts SLTP")
// === Inputs ===a
fastLen = input.int(9, "Fast EMA", minval=1)
slowLen = input.int(21, "Slow EMA", minval=1)
rsiLen = input.int(14, "RSI Length", minval=1)
rsiLongMax = input.int(70, "Max RSI to allow LONG", minval=50, maxval=90)
rsiShortMin = input.int(30, "Min RSI to allow SHORT", minval=10, maxval=50)
atrLen = input.int(14, "ATR Length", minval=1)
atrMultSL = input.float(1.5, "ATR Stop-Loss Multiplier", step=0.1)
atrMultTP = input.float(2.5, "ATR Take-Profit Multiplier", step=0.1)
// === Indicator calculations ===
price = close
fastEMA = ta.ema(price, fastLen)
slowEMA = ta.ema(price, slowLen)
rsiVal = ta.rsi(price, rsiLen)
atr = ta.atr(atrLen)
// === Entry signals ===
longSignal = ta.crossover(fastEMA, slowEMA) and rsiVal < rsiLongMax
shortSignal = ta.crossunder(fastEMA, slowEMA) and rsiVal > rsiShortMin
// === SL/TP Levels ===
longSL = price - atr * atrMultSL
longTP = price + atr * atrMultTP
shortSL = price + atr * atrMultSL
shortTP = price - atr * atrMultTP
// === Plotting ===
plot(fastEMA, color=color.orange, title="Fast EMA")
plot(slowEMA, color=color.blue, title="Slow EMA")
plotshape(longSignal, title="Buy Signal", style=shape.triangleup, color=color.new(color.green, 0), location=location.belowbar, size=size.tiny)
plotshape(shortSignal, title="Sell Signal", style=shape.triangledown, color=color.new(color.red, 0), location=location.abovebar, size=size.tiny)
// Optional visualization of SL/TP
plot(longSignal ? longSL : na, "Long Stop-Loss", color=color.new(color.red, 50), style=plot.style_linebr)
plot(longSignal ? longTP : na, "Long Take-Profit", color=color.new(color.green, 50), style=plot.style_linebr)
plot(shortSignal ? shortSL : na, "Short Stop-Loss", color=color.new(color.red, 50), style=plot.style_linebr)
plot(shortSignal ? shortTP : na, "Short Take-Profit", color=color.new(color.green, 50), style=plot.style_linebr)
// === Alerts with SL/TP info ===
alertcondition(longSignal, title="BUY Signal",
message="BUY Alert — NQ LONG: Entry @ {{close}} | SL: {{plot_1}} | TP: {{plot_2}} | {{ticker}}")
alertcondition(shortSignal, title="SELL Signal",
message="SELL Alert — NQ SHORT: Entry @ {{close}} | SL: {{plot_3}} | TP: {{plot_4}} | {{ticker}}")
// === Visual labels ===
if (longSignal)
label.new(bar_index, low, "BUY\nSL: " + str.tostring(longSL, format.mintick) + "\nTP: " + str.tostring(longTP, format.mintick),
style=label.style_label_up, color=color.new(#be14c4, 0), textcolor=color.white)
if (shortSignal)
label.new(bar_index, high, "SELL\nSL: " + str.tostring(shortSL, format.mintick) + "\nTP: " + str.tostring(shortTP, format.mintick),
style=label.style_label_down, color=color.new(color.red, 0), textcolor=color.white)
오픈 소스 스크립트
트레이딩뷰의 진정한 정신에 따라, 이 스크립트의 작성자는 이를 오픈소스로 공개하여 트레이더들이 기능을 검토하고 검증할 수 있도록 했습니다. 작성자에게 찬사를 보냅니다! 이 코드는 무료로 사용할 수 있지만, 코드를 재게시하는 경우 하우스 룰이 적용된다는 점을 기억하세요.
면책사항
해당 정보와 게시물은 금융, 투자, 트레이딩 또는 기타 유형의 조언이나 권장 사항으로 간주되지 않으며, 트레이딩뷰에서 제공하거나 보증하는 것이 아닙니다. 자세한 내용은 이용 약관을 참조하세요.
오픈 소스 스크립트
트레이딩뷰의 진정한 정신에 따라, 이 스크립트의 작성자는 이를 오픈소스로 공개하여 트레이더들이 기능을 검토하고 검증할 수 있도록 했습니다. 작성자에게 찬사를 보냅니다! 이 코드는 무료로 사용할 수 있지만, 코드를 재게시하는 경우 하우스 룰이 적용된다는 점을 기억하세요.
면책사항
해당 정보와 게시물은 금융, 투자, 트레이딩 또는 기타 유형의 조언이나 권장 사항으로 간주되지 않으며, 트레이딩뷰에서 제공하거나 보증하는 것이 아닙니다. 자세한 내용은 이용 약관을 참조하세요.