PROTECTED SOURCE SCRIPT
업데이트됨 RS GEE Candle Highlighter (vs SPY/QQQ) • 5m
RS Candle Highlighter (vs SPY/QQQ) – 5m
This indicator highlights candles where a stock shows relative strength outperforming a benchmark index (SPY or QQQ).
Strong candles are colored.
Works in real time on the 5-minute chart.
Helps identify stocks that are outperforming the market.
👉 Ideal for day trading, scalping, and relative performance analysis.
릴리즈 노트
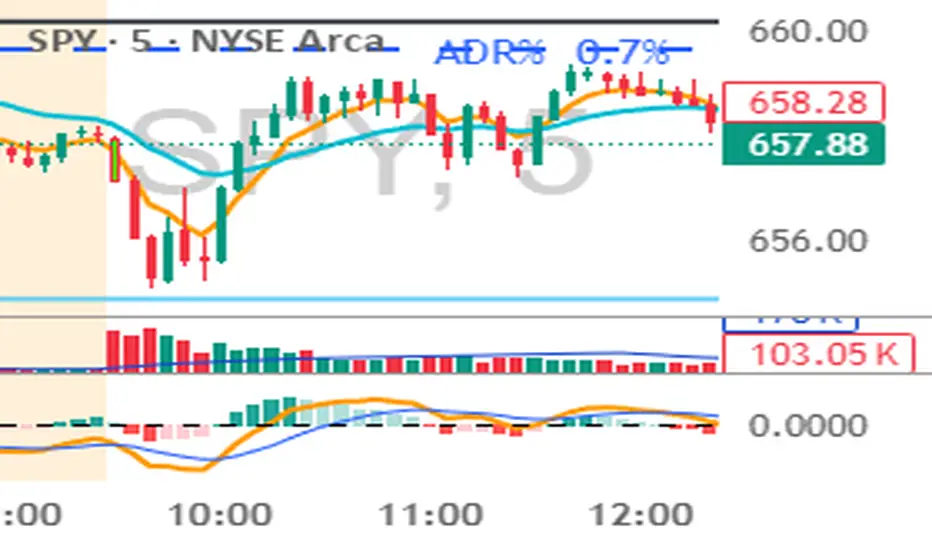
RS GEE Candle Highlighter (vs SPY/QQQ) – 5mThis indicator highlights candles where a stock shows relative strength outperforming a benchmark index (SPY or QQQ).
Strong candles are colored #74b3fe.
Works in real time on the 5-minute chart.
Helps identify stocks that are outperforming the market.
👉 Ideal for day trading, scalping, and relative performance analysis.
릴리즈 노트
RS Candle Highlighter (vs SPY/QQQ) – 5mThis indicator highlights candles of a stock that show relative strength vs. a benchmark index (SPY or QQQ) on a 5-minute chart.
It works in two steps:
Bar relative strength – compares the return of the current candle with the return of the benchmark over the same 5-minute period.
Cumulative relative strength – compares the stock’s performance over a rolling lookback window (user-defined, e.g. last 3–5 bars) with the benchmark’s cumulative return.
A candle is highlighted when both conditions are positive, meaning the stock is outperforming the index both on the current bar and across the recent window.
Features
Choice of benchmark: SPY or QQQ
Adjustable lookback window (number of bars for cumulative RS)
Adjustable outperformance margins for bar and cumulative signals
Colored candles (body or full candle) for clear visual detection
Optional labels (RS+) under candles
Built-in alert conditions for strong relative strength vs. SPY or QQQ
Use case
Quickly identify stocks showing early and exceptional strength versus the market or sector benchmark.
Especially useful during the first 15–30 minutes after the open, to spot leaders of the day.
🔑 Critical parameters to adjust
1. Cumulative window (lookbackBars)
If you want to detect very early, you need a short horizon.
Recommendation: 3 to 5 bars (i.e. 15–25 minutes).
👉 This lets you immediately see if a stock is outperforming right from the open, without waiting too long.
2. Outperformance margin – per bar (barEdgeBuffer)
You want to filter out microstructural noise.
On 5-minute charts, a liquid stock usually moves about ±0.05% naturally.
Recommendation: 0.001 (0.10%) to 0.002 (0.20%), depending on your tolerance.
👉 Below 0.05% it triggers too often; above 0.20% you risk missing the fast movers.
3. Outperformance margin – cumulative (cumEdgeBuffer)
To confirm that it’s not just a “one-off spike.”
Recommendation: 0.003 (0.30%) to 0.005 (0.50%).
👉 This way, after 3–5 bars, the stock has really accumulated strength versus the index.
보호된 스크립트입니다
이 스크립트는 비공개 소스로 게시됩니다. 하지만 이를 자유롭게 제한 없이 사용할 수 있습니다 – 자세한 내용은 여기에서 확인하세요.
면책사항
해당 정보와 게시물은 금융, 투자, 트레이딩 또는 기타 유형의 조언이나 권장 사항으로 간주되지 않으며, 트레이딩뷰에서 제공하거나 보증하는 것이 아닙니다. 자세한 내용은 이용 약관을 참조하세요.
면책사항
해당 정보와 게시물은 금융, 투자, 트레이딩 또는 기타 유형의 조언이나 권장 사항으로 간주되지 않으며, 트레이딩뷰에서 제공하거나 보증하는 것이 아닙니다. 자세한 내용은 이용 약관을 참조하세요.