INVITE-ONLY SCRIPT
TAS Float PCL + TAS Static PCL [TASMarketProfile]
TAS PRICE COMPRESSION LEVELS (PCLs) includes 2 distinct indicators that use volume at price analysis, volume aggregation and multi-timeframe confluence to calculate and display significant levels of commercial interest above and below the market. These levels reveal reliable trading levels which can be leveraged for enhanced trade entries, trailing stops and targets.
THERE ARE TWO TYPES OF TAS PCLs:
Both TAS Floaters and TAS Statics have up to 10 horizontal lines available to display. The four center lines are referred to as Points of Control (POC). Three of these lines are colored cyan and one is yellow. The yellow line is more prominent and referred to as the Master Point of Control (MPOC) of the Price Compression Levels on display. The first area of commercial support and resistance are plotted with red lines on both sides of the POC lines and commonly referred to as S1 and R1 levels. The next level of support and resistance areas are designated by blue lines (S2 and R2 levels) and then lastly the farthest from the POC lines are the green lines (S3 and R3 levels). By default, typically the green lines are not displayed but can be activated on an “as needed” basis within the indicator Style settings.
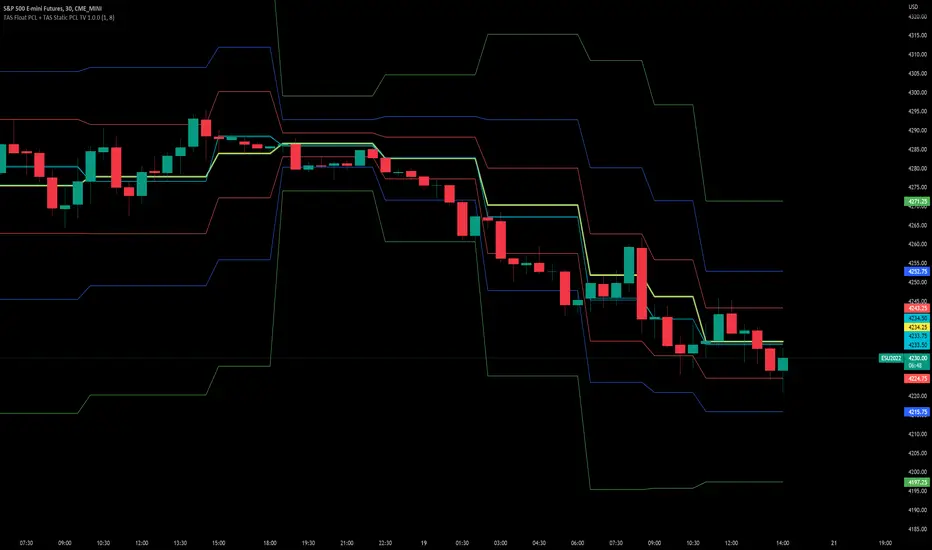
EXAMPLE OF TAS FLOAT PCLs:

ABOUT TAS FLOAT PCLs:
----------1) MinSignal_123: This setting controls the sensitivity of the calculations. The default is set to 1 and this represents the most sensitive input that makes it easiest for market conditions to trigger new PCL levels. A setting of 2 is considered “medium” sensitivity and lastly a setting of 3 would require the most substantial change in conditions to trigger an adjustment of PCLs on the chart.
----------2) Length: This input setting determines the number of bars of data included in the calculation for new TAS Float PCLs to be adjusted on the chart. The default is set to 8.
MORE ON INPUT SETTINGS:
BELOW ARE THE RECOMMENDED INPUT SETTINGS COMBINATIONS THAT WILL DICTATE HOW RESPONSIVE THE PCLs WILL REACT TO CONDITIONS:
ABOUT TAS STATIC PCLs:
TAS PRICE COMPRESSION LEVELS can be used as a stand-alone trading guidance system or in conjunction with other popular TASMarketProfile indicators.
Trade Well My Friends!
THERE ARE TWO TYPES OF TAS PCLs:
- TAS Float PCLs - These levels take into account new data flow throughout the trading session and expands or contracts the levels dynamically in accordance with changing market conditions. These are often referred to by traders as “Floaters” or “Dynamic PCLs.”
- TAS Static PCLs - These levels are set upon the start of the trading session and remain intact throughout the duration of the session. Many traders These are often referred to by traders as “Statics.”
Both TAS Floaters and TAS Statics have up to 10 horizontal lines available to display. The four center lines are referred to as Points of Control (POC). Three of these lines are colored cyan and one is yellow. The yellow line is more prominent and referred to as the Master Point of Control (MPOC) of the Price Compression Levels on display. The first area of commercial support and resistance are plotted with red lines on both sides of the POC lines and commonly referred to as S1 and R1 levels. The next level of support and resistance areas are designated by blue lines (S2 and R2 levels) and then lastly the farthest from the POC lines are the green lines (S3 and R3 levels). By default, typically the green lines are not displayed but can be activated on an “as needed” basis within the indicator Style settings.
EXAMPLE OF TAS FLOAT PCLs:
ABOUT TAS FLOAT PCLs:
- The TAS Dynamic PCLs (Floaters) reveal the price areas that attract commercial interest based on the current market conditions.
- How the PCLs are plotted can be adjusted with two inputs controlled by the user.
----------1) MinSignal_123: This setting controls the sensitivity of the calculations. The default is set to 1 and this represents the most sensitive input that makes it easiest for market conditions to trigger new PCL levels. A setting of 2 is considered “medium” sensitivity and lastly a setting of 3 would require the most substantial change in conditions to trigger an adjustment of PCLs on the chart.
----------2) Length: This input setting determines the number of bars of data included in the calculation for new TAS Float PCLs to be adjusted on the chart. The default is set to 8.
MORE ON INPUT SETTINGS:
- Using higher values in both inputs will display more significant areas of commercial interest for higher probability support and resistance levels around PCLs. These are referred to as “slow” Floaters.
- Using lower value inputs will create Floaters that are more responsive to market conditions. These are referred to as “fast” Floaters.
- When fast Floaters are contracted (cover a narrow range of prices) the market is tightly balanced and can easily enter into breakout conditions, if price closes outside of the TAS Float PCLs.
- Expanded Floaters that are wider apart provide for greater rotational range trading conditions.
BELOW ARE THE RECOMMENDED INPUT SETTINGS COMBINATIONS THAT WILL DICTATE HOW RESPONSIVE THE PCLs WILL REACT TO CONDITIONS:
- FAST (default): 1 - 8
- MEDIUM: 2 - 14
- SLOW: 3 - 34
- The user will typically choose to have either Statics or Float PCLs active on the chart at a time, but not both as you'll have up to 20 levels on your chart (too many). You can, however, put them on different panes. Visit the INPUT settings of the indicator to select which one you want active.
- The user can change the coloring, line type and thickness in the STYLE settings.
ABOUT TAS STATIC PCLs:
- Many traders opt for TAS Static PCLs because they prefer to know the significant commercial interest price areas before they trade.
- Unlike Floaters, TAS Static levels will not change throughout the trading session and are only affected if the user changes the opening and closing time parameters for the trading session displayed. By default, Static levels will recalculate and display new levels upon the reopen of the next session.
- Tightly compacted POC lines designate an area of particularly strong commercial interest that provides higher probability, lower risk entries for extended directional moves. These areas are often referred to as “walls.”
- If the POC lines are spread out over a wider range, a trader should be on the lookout for a more rotational trading session.
- Periodically, one of the POC lines may be plotted outside of a red line (S1 or R1). In this case, the market may be biased in the same direction that the POC line is in relation to the red line.
TAS PRICE COMPRESSION LEVELS can be used as a stand-alone trading guidance system or in conjunction with other popular TASMarketProfile indicators.
Trade Well My Friends!
초대 전용 스크립트
이 스크립트는 작성자가 승인한 사용자만 접근할 수 있습니다. 사용하려면 요청 후 승인을 받아야 하며, 일반적으로 결제 후에 허가가 부여됩니다. 자세한 내용은 아래 작성자의 안내를 따르거나 TASMarketProfile에게 직접 문의하세요.
트레이딩뷰는 스크립트의 작동 방식을 충분히 이해하고 작성자를 완전히 신뢰하지 않는 이상, 해당 스크립트에 비용을 지불하거나 사용하는 것을 권장하지 않습니다. 커뮤니티 스크립트에서 무료 오픈소스 대안을 찾아보실 수도 있습니다.
작성자 지시 사항
Learn more and get started at https://www.tasmarketprofile.com/
For help or inquiries, email Help@CandidTrading.com
면책사항
해당 정보와 게시물은 금융, 투자, 트레이딩 또는 기타 유형의 조언이나 권장 사항으로 간주되지 않으며, 트레이딩뷰에서 제공하거나 보증하는 것이 아닙니다. 자세한 내용은 이용 약관을 참조하세요.