OPEN-SOURCE SCRIPT
업데이트됨 Multi Timeframe Moving Average Selector
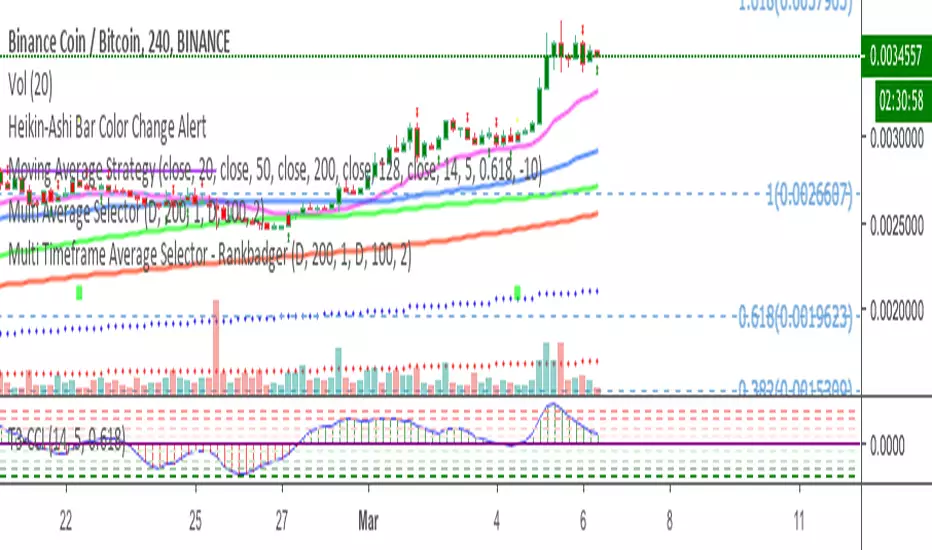
This allows you to plot a moving average on a different timeframe to the one you are viewing.
For instance if you are on a 4hr chart, you can plot the position of the daily 200MA, 100EMA etc
On a 15min chart you could plot where the hourly MAs are.
You can define the length of the MA and the style, EMA, SMA Hull MA etc, the colour and the type.
As with all my scripts I have pinched bits of other peoples and spliced them together with my own bits and bobs. Credit where it's due but I don't even know where most of this came from, it's pretty bothed together.
Feedback appreciated
릴리즈 노트
Update to include another MA defaults to 100EMA릴리즈 노트
Changed line to small dots so it stands out릴리즈 노트
update오픈 소스 스크립트
트레이딩뷰의 진정한 정신에 따라, 이 스크립트의 작성자는 이를 오픈소스로 공개하여 트레이더들이 기능을 검토하고 검증할 수 있도록 했습니다. 작성자에게 찬사를 보냅니다! 이 코드는 무료로 사용할 수 있지만, 코드를 재게시하는 경우 하우스 룰이 적용된다는 점을 기억하세요.
면책사항
해당 정보와 게시물은 금융, 투자, 트레이딩 또는 기타 유형의 조언이나 권장 사항으로 간주되지 않으며, 트레이딩뷰에서 제공하거나 보증하는 것이 아닙니다. 자세한 내용은 이용 약관을 참조하세요.
오픈 소스 스크립트
트레이딩뷰의 진정한 정신에 따라, 이 스크립트의 작성자는 이를 오픈소스로 공개하여 트레이더들이 기능을 검토하고 검증할 수 있도록 했습니다. 작성자에게 찬사를 보냅니다! 이 코드는 무료로 사용할 수 있지만, 코드를 재게시하는 경우 하우스 룰이 적용된다는 점을 기억하세요.
면책사항
해당 정보와 게시물은 금융, 투자, 트레이딩 또는 기타 유형의 조언이나 권장 사항으로 간주되지 않으며, 트레이딩뷰에서 제공하거나 보증하는 것이 아닙니다. 자세한 내용은 이용 약관을 참조하세요.