INVITE-ONLY SCRIPT
업데이트됨 MTF Dots BTC-Pair [Auto] [Moto]
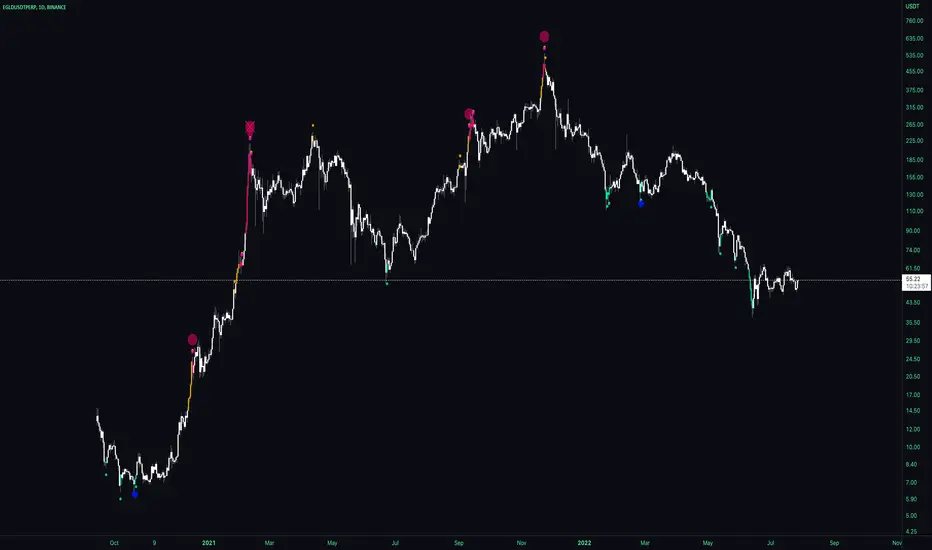
Hello traders,
Rsi is pretty commonly used and for some good reasons. When I'm trading, I don't always want to use the USDT/USDTPERP rsi, I want to see the correlated BTC pair Rsi of that asset
This script is similar to my MTF Dots and MTF Dots Cor scripts, but with an important and crucial distinction.
This shows user input oversold and overbought RSI metrics for multiple simultaneous timeframes comparatively to a perpetual futures contracts respective BTC pair automatically.
IMPORTANT: As of posting, the script will only show relevant information if the observed chart is a Binance perp chart. Any other chart and the script will not show data.
For example, if a user is on the BINANCE:SOLUSDTPERP chart, the script will show oversold and overbought Rsi data points for BINANCE:SOLBTC. If observing the BINANCE:ZRXUSDTPERP chart, it will give metrics for BINANCE:ZRXBTC Rsi.
There are six time frames, set to "Chart" resolution by default, which have individual period, overbought and oversold levels of strength.


DM for access,
Thanks
Rsi is pretty commonly used and for some good reasons. When I'm trading, I don't always want to use the USDT/USDTPERP rsi, I want to see the correlated BTC pair Rsi of that asset
This script is similar to my MTF Dots and MTF Dots Cor scripts, but with an important and crucial distinction.
This shows user input oversold and overbought RSI metrics for multiple simultaneous timeframes comparatively to a perpetual futures contracts respective BTC pair automatically.
IMPORTANT: As of posting, the script will only show relevant information if the observed chart is a Binance perp chart. Any other chart and the script will not show data.
For example, if a user is on the BINANCE:SOLUSDTPERP chart, the script will show oversold and overbought Rsi data points for BINANCE:SOLBTC. If observing the BINANCE:ZRXUSDTPERP chart, it will give metrics for BINANCE:ZRXBTC Rsi.
There are six time frames, set to "Chart" resolution by default, which have individual period, overbought and oversold levels of strength.
DM for access,
Thanks
릴리즈 노트
Included confluence filter via candle direction. Organized inputs into resolutions. Slight edit to first OS/OB level릴리즈 노트
Added tickers릴리즈 노트
Tweaked default values, added addition signal of conviction. Fixed typos. 릴리즈 노트
Added alerts for "Valley" and "Peak"초대 전용 스크립트
이 스크립트는 작성자가 승인한 사용자만 접근할 수 있습니다. 사용하려면 요청 후 승인을 받아야 하며, 일반적으로 결제 후에 허가가 부여됩니다. 자세한 내용은 아래 작성자의 안내를 따르거나 Intromoto에게 직접 문의하세요.
트레이딩뷰는 스크립트의 작동 방식을 충분히 이해하고 작성자를 완전히 신뢰하지 않는 이상, 해당 스크립트에 비용을 지불하거나 사용하는 것을 권장하지 않습니다. 커뮤니티 스크립트에서 무료 오픈소스 대안을 찾아보실 수도 있습니다.
작성자 지시 사항
DM for access
DM for access.
Follow on Twitter for updates.
One time fee, no subscription
twitter.com/IntroMoto
Follow on Twitter for updates.
One time fee, no subscription
twitter.com/IntroMoto
면책사항
해당 정보와 게시물은 금융, 투자, 트레이딩 또는 기타 유형의 조언이나 권장 사항으로 간주되지 않으며, 트레이딩뷰에서 제공하거나 보증하는 것이 아닙니다. 자세한 내용은 이용 약관을 참조하세요.
초대 전용 스크립트
이 스크립트는 작성자가 승인한 사용자만 접근할 수 있습니다. 사용하려면 요청 후 승인을 받아야 하며, 일반적으로 결제 후에 허가가 부여됩니다. 자세한 내용은 아래 작성자의 안내를 따르거나 Intromoto에게 직접 문의하세요.
트레이딩뷰는 스크립트의 작동 방식을 충분히 이해하고 작성자를 완전히 신뢰하지 않는 이상, 해당 스크립트에 비용을 지불하거나 사용하는 것을 권장하지 않습니다. 커뮤니티 스크립트에서 무료 오픈소스 대안을 찾아보실 수도 있습니다.
작성자 지시 사항
DM for access
DM for access.
Follow on Twitter for updates.
One time fee, no subscription
twitter.com/IntroMoto
Follow on Twitter for updates.
One time fee, no subscription
twitter.com/IntroMoto
면책사항
해당 정보와 게시물은 금융, 투자, 트레이딩 또는 기타 유형의 조언이나 권장 사항으로 간주되지 않으며, 트레이딩뷰에서 제공하거나 보증하는 것이 아닙니다. 자세한 내용은 이용 약관을 참조하세요.