OPEN-SOURCE SCRIPT
Multi-Timeframe Closures with Signals month week day
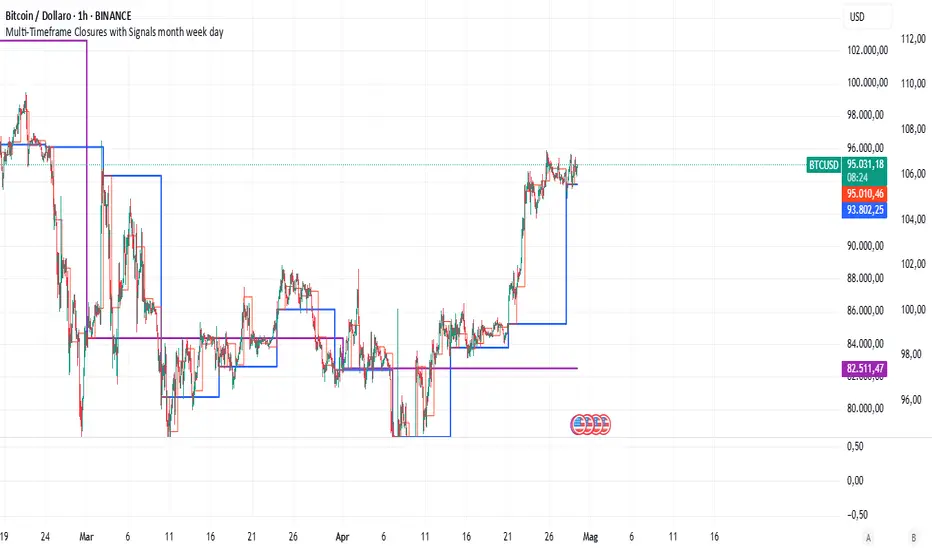
Multi-Timeframe Price Anchoring Indicator (Monthly, Weekly, Daily)
This indicator provides a powerful visual framework for analyzing price action across three major timeframes: monthly, weekly, and daily. It plots the closing prices of each timeframe directly on the chart to help traders assess where current price stands in relation to significant historical levels.
🔍 Core Features:
Monthly, Weekly, and Daily Close Lines: Automatically updated at the start of each new period.
Color-coded Price Anchors: Each timeframe is visually distinct for fast interpretation.
Multi-timeframe Awareness: Helps you identify trend alignment or divergence across different time horizons.
Long & Short Bias Signals: The script can optionally display long or short suggestions based on where the current price stands relative to the anchored closing prices.
📈 How to Use:
Trend Confirmation: If price is consistently above all three levels, it signals a strong bullish trend (potential long bias). If it’s below, the opposite applies (short bias).
Reversal or Pullback Zones: When price becomes extended far above/below the monthly and weekly closes, it may suggest overbought/oversold conditions and the possibility of a reversal or retracement.
Intraday Alignment: Useful for traders who want to enter positions on lower timeframes while being aware of higher timeframe trends.
This indicator is ideal for swing traders, day traders, and position traders who want to anchor their decisions to meaningful multi-timeframe reference points.
오픈 소스 스크립트
트레이딩뷰의 진정한 정신에 따라, 이 스크립트의 작성자는 이를 오픈소스로 공개하여 트레이더들이 기능을 검토하고 검증할 수 있도록 했습니다. 작성자에게 찬사를 보냅니다! 이 코드는 무료로 사용할 수 있지만, 코드를 재게시하는 경우 하우스 룰이 적용된다는 점을 기억하세요.
면책사항
해당 정보와 게시물은 금융, 투자, 트레이딩 또는 기타 유형의 조언이나 권장 사항으로 간주되지 않으며, 트레이딩뷰에서 제공하거나 보증하는 것이 아닙니다. 자세한 내용은 이용 약관을 참조하세요.
오픈 소스 스크립트
트레이딩뷰의 진정한 정신에 따라, 이 스크립트의 작성자는 이를 오픈소스로 공개하여 트레이더들이 기능을 검토하고 검증할 수 있도록 했습니다. 작성자에게 찬사를 보냅니다! 이 코드는 무료로 사용할 수 있지만, 코드를 재게시하는 경우 하우스 룰이 적용된다는 점을 기억하세요.
면책사항
해당 정보와 게시물은 금융, 투자, 트레이딩 또는 기타 유형의 조언이나 권장 사항으로 간주되지 않으며, 트레이딩뷰에서 제공하거나 보증하는 것이 아닙니다. 자세한 내용은 이용 약관을 참조하세요.