OPEN-SOURCE SCRIPT
Seasonality Charts
How to use: open monthly chart
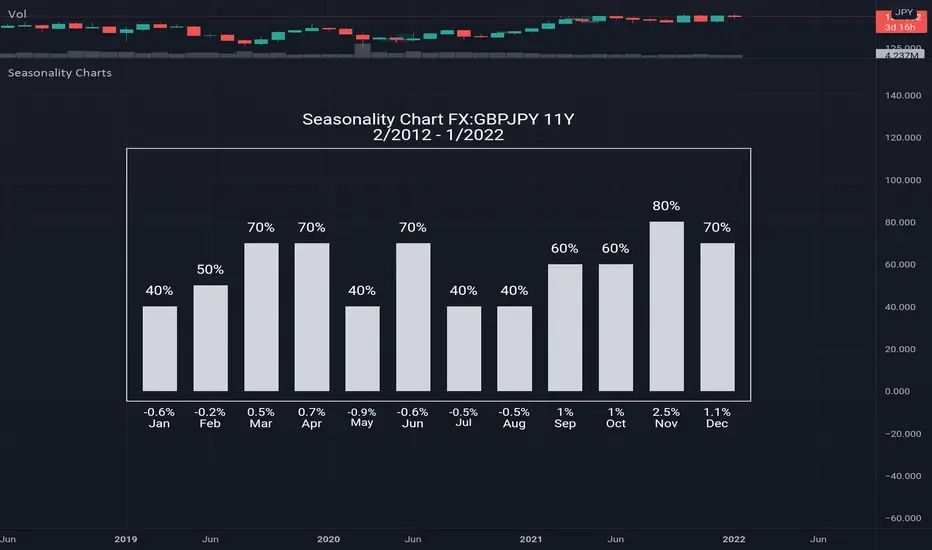
What this chart show: The seasonality tool calculates two numbers: the percentage of time that the month is positive above histogram and the average gain/loss for the month below histogram
Seasonality tells us what has happened in the past, which is the historical tendency. There is certainly no guarantee that past performance will equal future performance, but traders can look for above average tendencies to complement other signals. On the face of it, a bullish bias is present when a security shows gains more than 50% of the time for a particular month. Conversely, a bearish bias is present when a security rises less than 50% of the time. While 50% represents the exact middle, chartists should look for more extreme readings that suggest a relatively strong tendency.
오픈 소스 스크립트
트레이딩뷰의 진정한 정신에 따라, 이 스크립트의 작성자는 이를 오픈소스로 공개하여 트레이더들이 기능을 검토하고 검증할 수 있도록 했습니다. 작성자에게 찬사를 보냅니다! 이 코드는 무료로 사용할 수 있지만, 코드를 재게시하는 경우 하우스 룰이 적용된다는 점을 기억하세요.
면책사항
해당 정보와 게시물은 금융, 투자, 트레이딩 또는 기타 유형의 조언이나 권장 사항으로 간주되지 않으며, 트레이딩뷰에서 제공하거나 보증하는 것이 아닙니다. 자세한 내용은 이용 약관을 참조하세요.
오픈 소스 스크립트
트레이딩뷰의 진정한 정신에 따라, 이 스크립트의 작성자는 이를 오픈소스로 공개하여 트레이더들이 기능을 검토하고 검증할 수 있도록 했습니다. 작성자에게 찬사를 보냅니다! 이 코드는 무료로 사용할 수 있지만, 코드를 재게시하는 경우 하우스 룰이 적용된다는 점을 기억하세요.
면책사항
해당 정보와 게시물은 금융, 투자, 트레이딩 또는 기타 유형의 조언이나 권장 사항으로 간주되지 않으며, 트레이딩뷰에서 제공하거나 보증하는 것이 아닙니다. 자세한 내용은 이용 약관을 참조하세요.