OPEN-SOURCE SCRIPT
Opposite Delta Candle Highlighter with EMAs & Delta Boxes
**Description:**
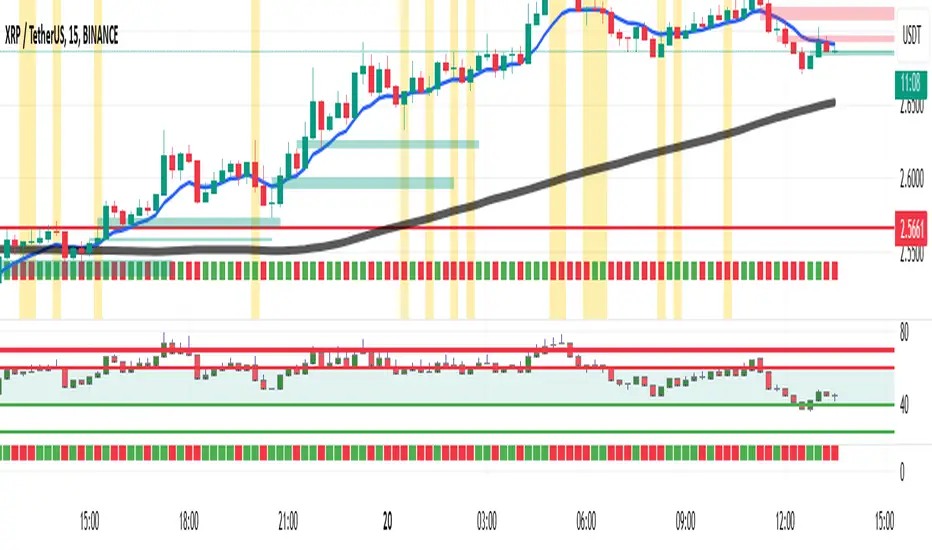
This indicator is designed to enhance market analysis by highlighting **candles with opposite-colored delta**, plotting **Exponential Moving Averages (EMAs)**, and displaying **delta volume as small boxes below the chart**.
🔹 **Key Features:**
✅ **Opposite Delta Candle Highlighting** – Candles where delta volume contradicts the price direction are highlighted with a **yellow background** and a **blue triangle** above the bar.
✅ **Three Exponential Moving Averages (EMAs)** – Includes **EMA (9, 21, 50)** to help identify trends and dynamic support/resistance levels.
✅ **Delta Volume Display** – Instead of large volume columns, delta is plotted as **small square boxes below the chart**, ensuring clear visibility without overlapping price candles.
✅ **Optimized for Lower Timeframes** – The indicator **automatically selects an appropriate lower timeframe** for more precise delta calculations.
🔹 **How It Works:**
- **Green Candle + Red Delta** → Opposite delta signal (Bearish Sign).
- **Red Candle + Green Delta** → Opposite delta signal (Bullish Sign).
- **Delta bars below the chart** indicate the strength of buying/selling pressure.
- **EMAs help identify the market trend** and potential trade entry zones.
🔹 **Use Cases:**
✔ **Scalping & Day Trading** – Identify potential reversals and trend continuation setups.
✔ **Volume Analysis** – Understand market participation and possible absorption.
✔ **Trend Confirmation** – Use EMAs to confirm trend direction alongside delta volume.
📌 *Best used with lower timeframes (1m, 5m, 15m) for detailed volume analysis.*
🚀 **Enhance your trading with real-time delta insights and price action analysis!**
오픈 소스 스크립트
트레이딩뷰의 진정한 정신에 따라, 이 스크립트의 작성자는 이를 오픈소스로 공개하여 트레이더들이 기능을 검토하고 검증할 수 있도록 했습니다. 작성자에게 찬사를 보냅니다! 이 코드는 무료로 사용할 수 있지만, 코드를 재게시하는 경우 하우스 룰이 적용된다는 점을 기억하세요.
면책사항
해당 정보와 게시물은 금융, 투자, 트레이딩 또는 기타 유형의 조언이나 권장 사항으로 간주되지 않으며, 트레이딩뷰에서 제공하거나 보증하는 것이 아닙니다. 자세한 내용은 이용 약관을 참조하세요.
오픈 소스 스크립트
트레이딩뷰의 진정한 정신에 따라, 이 스크립트의 작성자는 이를 오픈소스로 공개하여 트레이더들이 기능을 검토하고 검증할 수 있도록 했습니다. 작성자에게 찬사를 보냅니다! 이 코드는 무료로 사용할 수 있지만, 코드를 재게시하는 경우 하우스 룰이 적용된다는 점을 기억하세요.
면책사항
해당 정보와 게시물은 금융, 투자, 트레이딩 또는 기타 유형의 조언이나 권장 사항으로 간주되지 않으며, 트레이딩뷰에서 제공하거나 보증하는 것이 아닙니다. 자세한 내용은 이용 약관을 참조하세요.