OPEN-SOURCE SCRIPT
Profile Any Indicator [Kioseff Trading]
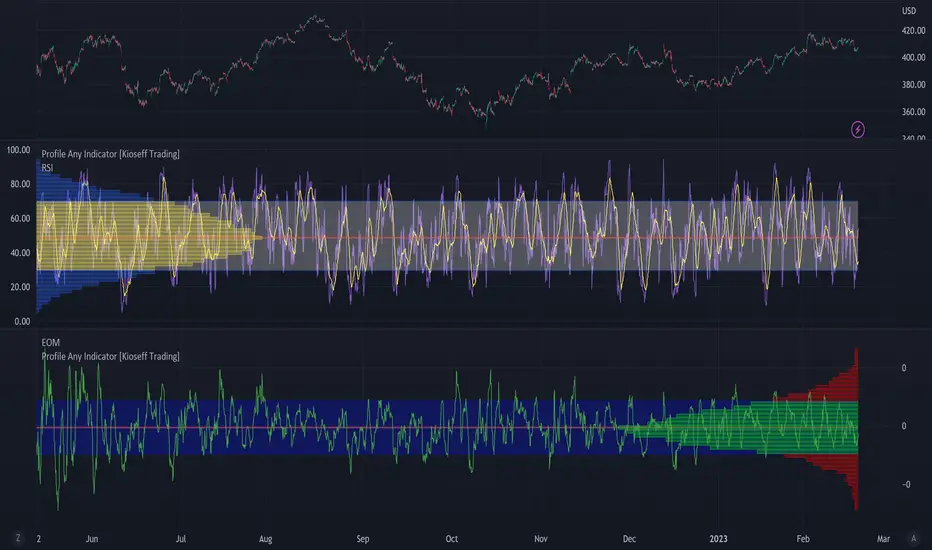
Create a visible-range profile for almost any indicator!
Hello!
This script "Profile Any Indicator" allows you to create a visible-range profile for *almost* any indicator hosted on TradingView.
Therefore, the only requirement:
1. Indicator must have a retrievable plot value.
Should your indicator have a retrievable plot value (most indicators do), you can use this script to create a visible-range profile of its values!
Consequently, the profile's always oriented to the left-most or right-most side of your chart - updating as you scroll left or right.

The image above shows me using the indicator to create a profile for MACD. I am largely zoomed out and the profile has adjusted to chart orientation.
Let's zoom in and see what happens!

Voila!
The indicator adjusted to my chart positioning and created a new visible-range profile! No manual adjustments are required (:
Instructions
1. Load the indicator you'd like to profile on the chart.

The image above shows me applying the OBV indicator to the chart. Additionally, the "Profile Any Indicator" script is also loaded on the chart, instructing me to add an indicator to its settings.
2. From the settings for "Profile Any indicator", locate the "Indicator" setting and select the indicator you would like to profile.

The image above shows me selecting the OBV indicator in the settings for "Profile Any Indicator".
Once steps 1 and 2 are complete you'll have a visible-range profile for the selected indicator on your chart!

The image above shows the completion of the process.
3. Merge the indicator pane or select to plot the selected indicator in the current pane.
From here, you can select to plot the value of the selected indicator in the current pane or merge the selected indicator's pane (which must stay on the chart) with the pane designated to the "Profile Any Indicator" script.

The image above shows the two panes merged.

The image above shows the two panes separate. Alternatively, in the settings for "Profile Any Indicator", I selected to plot OBV in its pane.

You can select to populate the visible-range profile on the right of the chart!
Additionally, you can modify the POC line, value area %, and, essentially, any parameter you'd find for a volume-profile-like indicator!
Thanks for checking this out (:
Hello!
This script "Profile Any Indicator" allows you to create a visible-range profile for *almost* any indicator hosted on TradingView.
Therefore, the only requirement:
1. Indicator must have a retrievable plot value.
Should your indicator have a retrievable plot value (most indicators do), you can use this script to create a visible-range profile of its values!
Consequently, the profile's always oriented to the left-most or right-most side of your chart - updating as you scroll left or right.
The image above shows me using the indicator to create a profile for MACD. I am largely zoomed out and the profile has adjusted to chart orientation.
Let's zoom in and see what happens!
Voila!
The indicator adjusted to my chart positioning and created a new visible-range profile! No manual adjustments are required (:
Instructions
1. Load the indicator you'd like to profile on the chart.
The image above shows me applying the OBV indicator to the chart. Additionally, the "Profile Any Indicator" script is also loaded on the chart, instructing me to add an indicator to its settings.
2. From the settings for "Profile Any indicator", locate the "Indicator" setting and select the indicator you would like to profile.
The image above shows me selecting the OBV indicator in the settings for "Profile Any Indicator".
Once steps 1 and 2 are complete you'll have a visible-range profile for the selected indicator on your chart!
The image above shows the completion of the process.
3. Merge the indicator pane or select to plot the selected indicator in the current pane.
From here, you can select to plot the value of the selected indicator in the current pane or merge the selected indicator's pane (which must stay on the chart) with the pane designated to the "Profile Any Indicator" script.
The image above shows the two panes merged.
The image above shows the two panes separate. Alternatively, in the settings for "Profile Any Indicator", I selected to plot OBV in its pane.
You can select to populate the visible-range profile on the right of the chart!
Additionally, you can modify the POC line, value area %, and, essentially, any parameter you'd find for a volume-profile-like indicator!
Thanks for checking this out (:
오픈 소스 스크립트
트레이딩뷰의 진정한 정신에 따라, 이 스크립트의 작성자는 이를 오픈소스로 공개하여 트레이더들이 기능을 검토하고 검증할 수 있도록 했습니다. 작성자에게 찬사를 보냅니다! 이 코드는 무료로 사용할 수 있지만, 코드를 재게시하는 경우 하우스 룰이 적용된다는 점을 기억하세요.
•Access to Next-Gen Optimization Tools: tradingiq.io
•Discord Server: discord.gg/aKWPuM4HPy
•Discord Server: discord.gg/aKWPuM4HPy
면책사항
해당 정보와 게시물은 금융, 투자, 트레이딩 또는 기타 유형의 조언이나 권장 사항으로 간주되지 않으며, 트레이딩뷰에서 제공하거나 보증하는 것이 아닙니다. 자세한 내용은 이용 약관을 참조하세요.