INVITE-ONLY SCRIPT
업데이트됨 SMT/Divergence Suite (any Indicator)
Hello Traders!
The TRN SMT/Divergence Suite detects divergences for any given indicator, even custom ones and divergences any two given instruments (SMT – smart money technique/tool). The indicator finds with unrivaled precision bullish and bearish as well as regular and hidden divergences. The main difference compared to other SMT/divergences indicators is that this indicator finds rigorously the extreme peaks of each swing, both in price and in the corresponding indicator/instrument. This precision is unmatched and therefore this is one of the best SMT/divergences detectors. The indicator helps traders to identify potential changes in trend before they occur.

Feature List
The TRN SMT/Divergence Suite works with any given indicator, even custom ones. In addition, there are 11 built-in indicators. We have chosen a selection of different momentum, trend following and volume oscillators that gives you maximum flexibility. Most noticeable is the cumulative delta indicator, which works astonishingly well as a divergence indicator.
Following is the full list of the build in indicators/oscillators:
The divergences are colored with vivid lines and labels. Bullish divergences are distinguished with luminous blue lines, while bearish divergences are denoted by striking red lines. Upon detecting a divergence, the colored lines act as a visual indicator for traders, signaling an imminent possibility of a trend reversal. In response, traders can leverage this valuable insight to make informed decisions in their trading activities.
Choose Your Custom Divergence Indicator
Handpick your custom indicator, and the TRN SMT/Divergence Suite will hunt for divergences in your preferred market and timeframe. Importantly, you must add the indicator to your chart. Afterwards, simply go to the “Parameters” section in the indicator settings and choose "External Indicator/SMT". If the custom indicator has one reference value, then choose this value in the “External Indicator/SMT (High)” field. If there are high and low values (e.g. candles), then you also must set the “External Indicator Low/SMT” field.
In the provided graphic, we've chosen the stochastic RSI as our example, and as you can see, the TRN SMT/Divergence Suite instantly identifies and plots bullish and bearish divergences on your chart.
Make sure that the TRN SMT/Divergence Suite is in the same panel as the custom divergence indicator and that both indicators are pinned to the same scale of your chart.

Smart Money Technique (SMT)/Divergence detecting in Relation to other Instruments
Smart Money Technique/Tool (SMT) means the divergence detection between two related instruments. The TRN SMT/Divergence Suite finds divergences in relation to other instruments, e.g. NQ vs. ES or BTCUSDT vs. ETHUSDT. Just add another instrument to the chart. As representation style you can choose lines or candles/bars. Afterwards, simply go to the “Parameters” section in the indicator settings and choose "External Indicator/SMT". If the second instrument is represented as line, then choose this value in the “External Indicator/SMT (High)” field. If there are high and low values (e.g. candles/bars), then you also must set the “External Indicator/SMT Low” field.

The detection of SMTs can help traders to decide whether the trend continues, or a reversal is imminent. E.g. if the NQ makes a new higher high but the ES fails to do so and makes a new lower high, then the TRN SMT/Divergence Suite shows a divergence. As a result, the probability is high that the trend will not continue, and the trader can make an informed decision about what to do next.
How to set Parameters for Divergence Indicators
To begin, access the indicator settings. Look for the "Parameters" section where you can fine-tune Parameters 1-3. The default settings are already optimized for the oscillators AO, RSI, CDV, W%R, MFI and Stochastic. For other divergence indicators, you might want to adjust the settings to your liking. The parameter order is the same as in the corresponding divergence indicator.
What are Divergences?
When the price of an asset moves in one direction, but its indicators move in the opposite direction, this is called a divergence. Divergences can be a powerful signal that a trend reversal is about to occur.
There are two types of regular divergences: bullish and bearish. A bullish divergence occurs when the price of an asset makes a lower low, but its indicators make a higher low. This can be a sign that the asset is oversold and that a reversal is imminent. A bearish divergence, on the other hand, occurs when the price of an asset makes a higher high, but its indicators (such as Relative Strength Index - RSI) make a lower high. This can be a sign that the asset is overbought and that a reversal is imminent.
Next to regular divergences there are hidden divergences. These divergences occur when the price of an asset moves in the opposite direction of an indicator, suggesting a possible shift in the underlying trend. In trading, hidden bearish and hidden bullish divergences are patterns that traders often look for on price charts to identify potential trend reversals or continuation patterns.
Conclusion
While signals from TRN SMT/Divergence Suite can be informative, it is important to recognize that their reliability may vary. Bearish and bullish divergences are not foolproof indicators and should be used in conjunction with other analysis techniques and risk management strategies.
Risk Disclaimer
The content, tools, scripts, articles, and educational resources offered by TRN Trading are intended solely for informational and educational purposes. Remember, past performance does not ensure future outcomes.
The TRN SMT/Divergence Suite detects divergences for any given indicator, even custom ones and divergences any two given instruments (SMT – smart money technique/tool). The indicator finds with unrivaled precision bullish and bearish as well as regular and hidden divergences. The main difference compared to other SMT/divergences indicators is that this indicator finds rigorously the extreme peaks of each swing, both in price and in the corresponding indicator/instrument. This precision is unmatched and therefore this is one of the best SMT/divergences detectors. The indicator helps traders to identify potential changes in trend before they occur.
Feature List
- Works with any given custom oscillators or indicator
- SMT (Smart Money Technique)/Divergence detecting for any given instruments
- 11 different build-in oscillators (incl. Cumulative Delta)
- Customizable look and feel
The TRN SMT/Divergence Suite works with any given indicator, even custom ones. In addition, there are 11 built-in indicators. We have chosen a selection of different momentum, trend following and volume oscillators that gives you maximum flexibility. Most noticeable is the cumulative delta indicator, which works astonishingly well as a divergence indicator.
Following is the full list of the build in indicators/oscillators:
- Awesome Oscillator (AO)
- Commodity Channel Index (CCI)
- Cumulative Delta Volume (CDV)
- Chaikin Money Flow (CMF)
- Moving Average Convergence Divergence (MACD)
- Money Flow Index (MFI)
- Momentum
- On Balance Volume (OBV)
- Relative Strength Index (RSI)
- Stochastic
- Williams Percentage Range (W%R)
The divergences are colored with vivid lines and labels. Bullish divergences are distinguished with luminous blue lines, while bearish divergences are denoted by striking red lines. Upon detecting a divergence, the colored lines act as a visual indicator for traders, signaling an imminent possibility of a trend reversal. In response, traders can leverage this valuable insight to make informed decisions in their trading activities.
Choose Your Custom Divergence Indicator
Handpick your custom indicator, and the TRN SMT/Divergence Suite will hunt for divergences in your preferred market and timeframe. Importantly, you must add the indicator to your chart. Afterwards, simply go to the “Parameters” section in the indicator settings and choose "External Indicator/SMT". If the custom indicator has one reference value, then choose this value in the “External Indicator/SMT (High)” field. If there are high and low values (e.g. candles), then you also must set the “External Indicator Low/SMT” field.
In the provided graphic, we've chosen the stochastic RSI as our example, and as you can see, the TRN SMT/Divergence Suite instantly identifies and plots bullish and bearish divergences on your chart.
Make sure that the TRN SMT/Divergence Suite is in the same panel as the custom divergence indicator and that both indicators are pinned to the same scale of your chart.
Smart Money Technique (SMT)/Divergence detecting in Relation to other Instruments
Smart Money Technique/Tool (SMT) means the divergence detection between two related instruments. The TRN SMT/Divergence Suite finds divergences in relation to other instruments, e.g. NQ vs. ES or BTCUSDT vs. ETHUSDT. Just add another instrument to the chart. As representation style you can choose lines or candles/bars. Afterwards, simply go to the “Parameters” section in the indicator settings and choose "External Indicator/SMT". If the second instrument is represented as line, then choose this value in the “External Indicator/SMT (High)” field. If there are high and low values (e.g. candles/bars), then you also must set the “External Indicator/SMT Low” field.
The detection of SMTs can help traders to decide whether the trend continues, or a reversal is imminent. E.g. if the NQ makes a new higher high but the ES fails to do so and makes a new lower high, then the TRN SMT/Divergence Suite shows a divergence. As a result, the probability is high that the trend will not continue, and the trader can make an informed decision about what to do next.
How to set Parameters for Divergence Indicators
To begin, access the indicator settings. Look for the "Parameters" section where you can fine-tune Parameters 1-3. The default settings are already optimized for the oscillators AO, RSI, CDV, W%R, MFI and Stochastic. For other divergence indicators, you might want to adjust the settings to your liking. The parameter order is the same as in the corresponding divergence indicator.
What are Divergences?
When the price of an asset moves in one direction, but its indicators move in the opposite direction, this is called a divergence. Divergences can be a powerful signal that a trend reversal is about to occur.
There are two types of regular divergences: bullish and bearish. A bullish divergence occurs when the price of an asset makes a lower low, but its indicators make a higher low. This can be a sign that the asset is oversold and that a reversal is imminent. A bearish divergence, on the other hand, occurs when the price of an asset makes a higher high, but its indicators (such as Relative Strength Index - RSI) make a lower high. This can be a sign that the asset is overbought and that a reversal is imminent.
Next to regular divergences there are hidden divergences. These divergences occur when the price of an asset moves in the opposite direction of an indicator, suggesting a possible shift in the underlying trend. In trading, hidden bearish and hidden bullish divergences are patterns that traders often look for on price charts to identify potential trend reversals or continuation patterns.
Conclusion
While signals from TRN SMT/Divergence Suite can be informative, it is important to recognize that their reliability may vary. Bearish and bullish divergences are not foolproof indicators and should be used in conjunction with other analysis techniques and risk management strategies.
Risk Disclaimer
The content, tools, scripts, articles, and educational resources offered by TRN Trading are intended solely for informational and educational purposes. Remember, past performance does not ensure future outcomes.
릴리즈 노트
We changed the divergence alerts to be triggered only once the divergence is confirmed.릴리즈 노트
We added the option to use confirmed and/or unconfirmed SMT/divergence alerts.릴리즈 노트
The following updates have been made:- The Settings UI has been improved.
- The CVD algorithm has been updated to make it more precise.
- Individual settings for oscillators have been added.
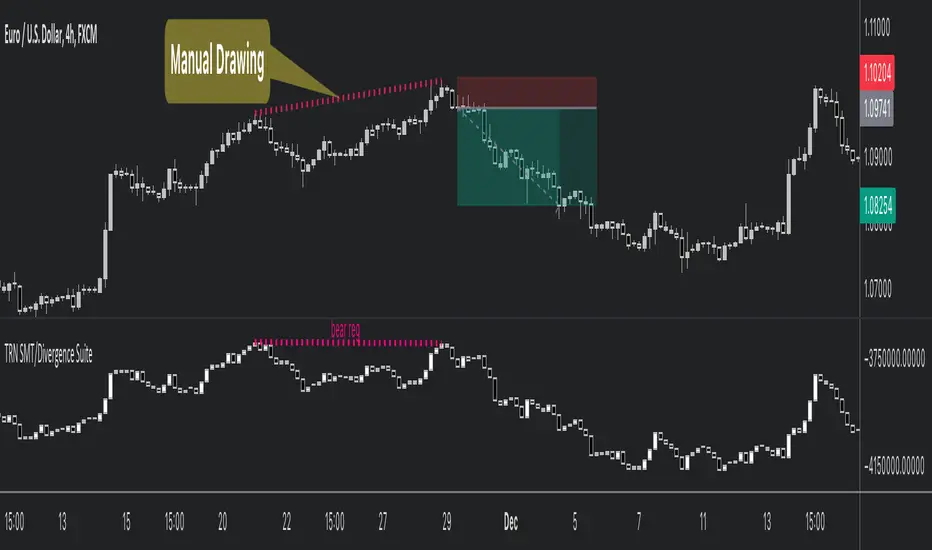
- Drawings are now enabled on the main chart.
릴리즈 노트
Alerts have been fixed.릴리즈 노트
Oscillator drawing and default values fixed릴리즈 노트
The alert bug is fixed now. Alerts for SMT Divergences will get triggered again on all your favorite assets and timeframes.초대 전용 스크립트
이 스크립트는 작성자가 승인한 사용자만 접근할 수 있습니다. 사용하려면 요청 후 승인을 받아야 하며, 일반적으로 결제 후에 허가가 부여됩니다. 자세한 내용은 아래 작성자의 안내를 따르거나 TRN-Trading에게 직접 문의하세요.
트레이딩뷰는 스크립트의 작동 방식을 충분히 이해하고 작성자를 완전히 신뢰하지 않는 이상, 해당 스크립트에 비용을 지불하거나 사용하는 것을 권장하지 않습니다. 커뮤니티 스크립트에서 무료 오픈소스 대안을 찾아보실 수도 있습니다.
작성자 지시 사항
Access: https://trntrading.ai
The content, tools, scripts, articles, and educational resources offered by TRN Trading are intended solely for informational and educational purposes. Remember, past performance does not ensure future outcomes.
Get Instant Access NOW: trntrading.ai
Join Our Free Discord: discord.gg/JmPJkKtE8Q
Documentation: docs.trntrading.ai
Join Our Free Discord: discord.gg/JmPJkKtE8Q
Documentation: docs.trntrading.ai
면책사항
해당 정보와 게시물은 금융, 투자, 트레이딩 또는 기타 유형의 조언이나 권장 사항으로 간주되지 않으며, 트레이딩뷰에서 제공하거나 보증하는 것이 아닙니다. 자세한 내용은 이용 약관을 참조하세요.
초대 전용 스크립트
이 스크립트는 작성자가 승인한 사용자만 접근할 수 있습니다. 사용하려면 요청 후 승인을 받아야 하며, 일반적으로 결제 후에 허가가 부여됩니다. 자세한 내용은 아래 작성자의 안내를 따르거나 TRN-Trading에게 직접 문의하세요.
트레이딩뷰는 스크립트의 작동 방식을 충분히 이해하고 작성자를 완전히 신뢰하지 않는 이상, 해당 스크립트에 비용을 지불하거나 사용하는 것을 권장하지 않습니다. 커뮤니티 스크립트에서 무료 오픈소스 대안을 찾아보실 수도 있습니다.
작성자 지시 사항
Access: https://trntrading.ai
The content, tools, scripts, articles, and educational resources offered by TRN Trading are intended solely for informational and educational purposes. Remember, past performance does not ensure future outcomes.
Get Instant Access NOW: trntrading.ai
Join Our Free Discord: discord.gg/JmPJkKtE8Q
Documentation: docs.trntrading.ai
Join Our Free Discord: discord.gg/JmPJkKtE8Q
Documentation: docs.trntrading.ai
면책사항
해당 정보와 게시물은 금융, 투자, 트레이딩 또는 기타 유형의 조언이나 권장 사항으로 간주되지 않으며, 트레이딩뷰에서 제공하거나 보증하는 것이 아닙니다. 자세한 내용은 이용 약관을 참조하세요.