OPEN-SOURCE SCRIPT
업데이트됨 Market Structure - Multi-Timeframe

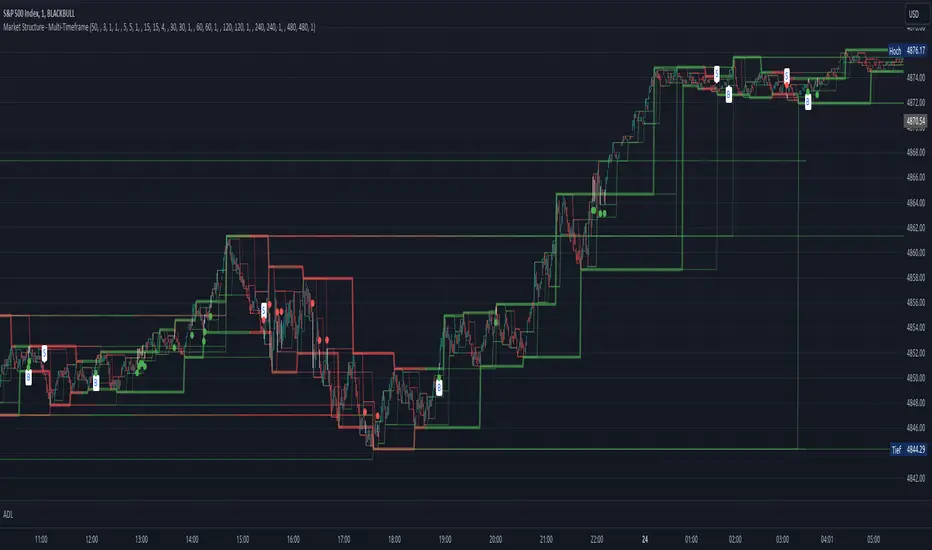
Pivot based channels for 8 individual time-frames. This can be used to identify the support and resistance level for different time-frames. Recommended is 1min as timeframe for the candles sticks. The direction for every pivot-channel is marked in green for bullish and red vor bearish. There exists alerts for Choch and BoS for every timeframe.
릴리즈 노트
Market structure is an important concept in trading that refers to the organization and behavior of prices in a market. Here I explain the concepts of HH (Higher Highs), HL (Higher Lows), LH (Lower Highs) and LL (Lower Lows) and how they relate to Change of Character and Break of Structure, particularly in the context of Support and Resistance.Higher Highs (HH) and Higher Lows (HL):
Higher High (HH): An HH occurs when the current high is higher than the previous high.
Higher Low (HL): A HL occurs when the current low point is higher than the previous low point.
These patterns indicate an uptrend. On different timeframes, HH and HL indicate continued buyer strength and can be viewed as confirmation of an existing trend. They are often associated with an intact support structure as the market tends to stabilize at higher levels.
Lower Highs (LH) and Lower Lows (LL):
Lower High (LH): An LH occurs when the current high is lower than the previous high.
Lower Low (LL): An LL occurs when the current low point is lower than the previous low point.
These patterns indicate a downward trend. LH and LL indicate continued weakness from buyers and can be viewed as confirmation of an existing downtrend. They are often associated with an intact resistance structure as the market tends to stabilize at lower levels.
Change of Character (CoC):
A change of character occurs when the market moves from a prevailing trend to a sideways movement or a new trend. This could be indicated by the appearance of HLs after HHs (or vice versa), indicating a possible change in market sentiment.
Break of Structure (BoS):
A break of structure occurs when the market breaks through a key support or resistance level. This could signal a trend reversal or the continuation of an existing trend.
Connection to support and resistance:
Support and resistance are crucial concepts in market structure. Support refers to price levels where demand is strong enough to prevent a decline. Resistance refers to price levels where supply is strong enough to prevent an increase.
HH and HL can serve as confirmation of support, while LH and LL can be associated with resistance.
Change of Character and Break of Structure can be directly related to Support and Resistance. A BoS below support could indicate weakness, while a BoS above resistance could indicate possible strength.
Overall, these concepts help traders understand market structure and make trading decisions based on trend confirmations, trend reversals, and key levels of support and resistance.
The script shows the following:
- Support and resistance lines for 8 different timeframes
- Trend direction for every timeframe individual
- Break of structure (BoS)
- Change of character (ChoCh)
- Alerts for Bos and ChoCh
릴리즈 노트
Add line-width for every timeframe오픈 소스 스크립트
트레이딩뷰의 진정한 정신에 따라, 이 스크립트의 작성자는 이를 오픈소스로 공개하여 트레이더들이 기능을 검토하고 검증할 수 있도록 했습니다. 작성자에게 찬사를 보냅니다! 이 코드는 무료로 사용할 수 있지만, 코드를 재게시하는 경우 하우스 룰이 적용된다는 점을 기억하세요.
면책사항
해당 정보와 게시물은 금융, 투자, 트레이딩 또는 기타 유형의 조언이나 권장 사항으로 간주되지 않으며, 트레이딩뷰에서 제공하거나 보증하는 것이 아닙니다. 자세한 내용은 이용 약관을 참조하세요.
오픈 소스 스크립트
트레이딩뷰의 진정한 정신에 따라, 이 스크립트의 작성자는 이를 오픈소스로 공개하여 트레이더들이 기능을 검토하고 검증할 수 있도록 했습니다. 작성자에게 찬사를 보냅니다! 이 코드는 무료로 사용할 수 있지만, 코드를 재게시하는 경우 하우스 룰이 적용된다는 점을 기억하세요.
면책사항
해당 정보와 게시물은 금융, 투자, 트레이딩 또는 기타 유형의 조언이나 권장 사항으로 간주되지 않으며, 트레이딩뷰에서 제공하거나 보증하는 것이 아닙니다. 자세한 내용은 이용 약관을 참조하세요.