OPEN-SOURCE SCRIPT
업데이트됨 Fiyat - 55 EMA Uzaklık Sinyali
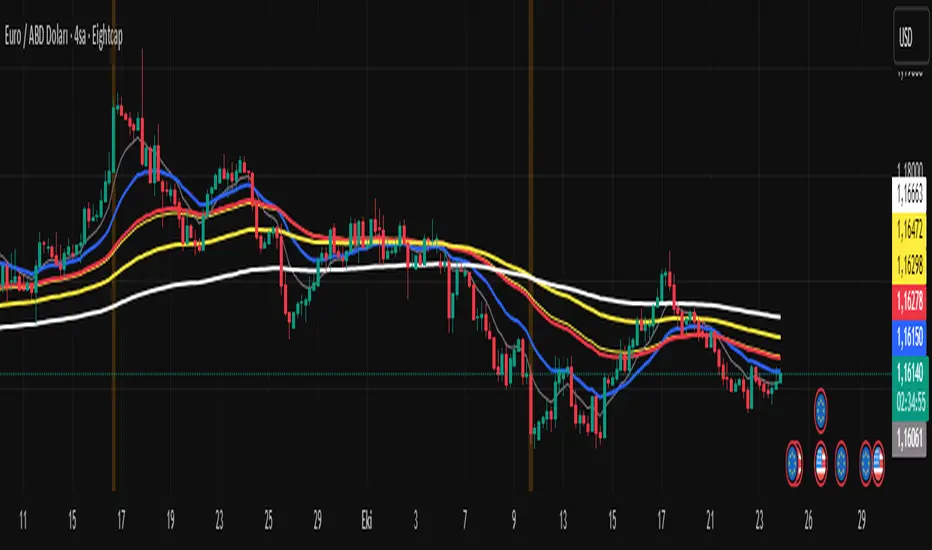
This indicator generates a signal when the price moves a certain percentage away from the 55-period Exponential Moving Average (EMA).
It helps traders identify when the market is stretched too far from its mean level, which can indicate potential reversal or continuation zones.
⚙️ How It Works
Calculates the 55 EMA on the selected chart.
Measures the percentage distance between the current price and the 55 EMA.
When the price distance exceeds the user-defined threshold (default: 0.50%), a visual signal (orange triangle) appears on the chart.
The background also highlights the signal candle.
🧩 Inputs
EMA Length: Default = 55 (can be changed).
Distance Threshold (%): Default = 0.50 → Change to detect stronger or weaker price deviations.
릴리즈 노트
This script creates a unified trading signal based on the distance between the white and red lines (no yellow line involved).The white line represents the short-term slope of your moving average.
The red line is a slower moving average of that slope.
When the distance between these two lines becomes greater than a user-defined threshold, a green signal appears.
Both buy and sell signals are displayed in the same color (green) — the color only indicates that a significant distance has been reached, not the direction.
오픈 소스 스크립트
트레이딩뷰의 진정한 정신에 따라, 이 스크립트의 작성자는 이를 오픈소스로 공개하여 트레이더들이 기능을 검토하고 검증할 수 있도록 했습니다. 작성자에게 찬사를 보냅니다! 이 코드는 무료로 사용할 수 있지만, 코드를 재게시하는 경우 하우스 룰이 적용된다는 점을 기억하세요.
면책사항
해당 정보와 게시물은 금융, 투자, 트레이딩 또는 기타 유형의 조언이나 권장 사항으로 간주되지 않으며, 트레이딩뷰에서 제공하거나 보증하는 것이 아닙니다. 자세한 내용은 이용 약관을 참조하세요.
오픈 소스 스크립트
트레이딩뷰의 진정한 정신에 따라, 이 스크립트의 작성자는 이를 오픈소스로 공개하여 트레이더들이 기능을 검토하고 검증할 수 있도록 했습니다. 작성자에게 찬사를 보냅니다! 이 코드는 무료로 사용할 수 있지만, 코드를 재게시하는 경우 하우스 룰이 적용된다는 점을 기억하세요.
면책사항
해당 정보와 게시물은 금융, 투자, 트레이딩 또는 기타 유형의 조언이나 권장 사항으로 간주되지 않으며, 트레이딩뷰에서 제공하거나 보증하는 것이 아닙니다. 자세한 내용은 이용 약관을 참조하세요.