PROTECTED SOURCE SCRIPT
ICT Killzones with Market Behavior
Indicator Title: ICT Killzones with Market Behavior
Description:
Introducing the ICT Killzones with Market Behavior indicator, a powerful tool designed for traders looking to capitalize on key trading timeframes in the New York session.
Key Features:
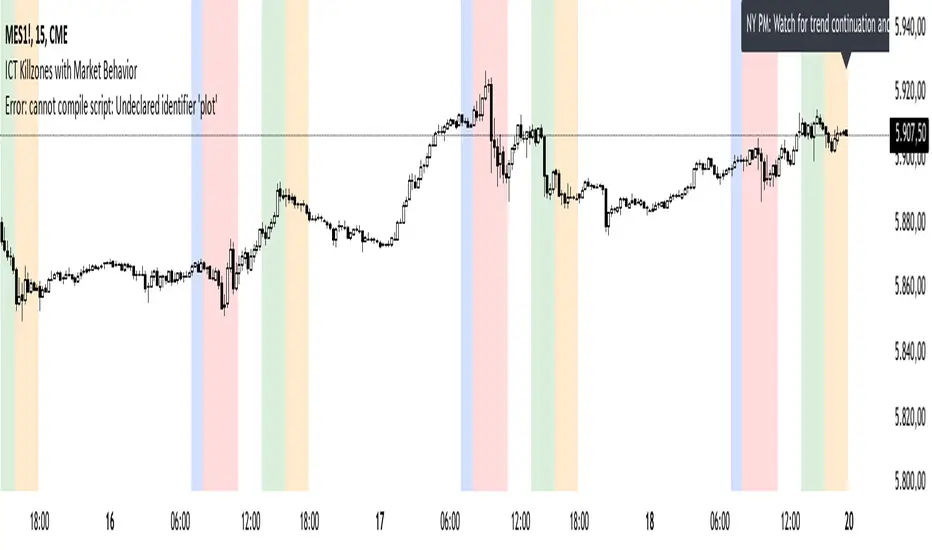
Visual Timeframes: This indicator highlights essential trading periods, including Pre-Market, NY Open, NY Lunch, and NY PM sessions. These visual markers help you quickly identify when the market is likely to experience heightened activity and liquidity.
Real-Time Insights: Stay informed with dynamic text displayed at the top of your chart. The indicator updates in real-time, providing actionable insights on what to expect during each session—whether it’s volatility, consolidation, or potential trend continuation.
Custom Color Options: Tailor the color settings for each killzone to fit your personal trading style and enhance the visual clarity of your chart.
User-Friendly Design: Built with simplicity in mind, this indicator integrates seamlessly into TradingView, making it easy for traders of all experience levels to utilize.
How to Use:
Add to Your Chart: Integrate the ICT Killzones with Market Behavior indicator into your TradingView setup.
Monitor Market Conditions: Keep an eye on the highlighted timeframes and the real-time insights displayed at the top. This information can guide your trading strategy effectively.
Adjust Your Approach: Use the insights from the indicator to modify your trading decisions based on the expected market behavior during each session.
Note: This indicator is for educational purposes only and should not be interpreted as financial advice. Always perform your own research and assess risks before making any trading decisions.
Description:
Introducing the ICT Killzones with Market Behavior indicator, a powerful tool designed for traders looking to capitalize on key trading timeframes in the New York session.
Key Features:
Visual Timeframes: This indicator highlights essential trading periods, including Pre-Market, NY Open, NY Lunch, and NY PM sessions. These visual markers help you quickly identify when the market is likely to experience heightened activity and liquidity.
Real-Time Insights: Stay informed with dynamic text displayed at the top of your chart. The indicator updates in real-time, providing actionable insights on what to expect during each session—whether it’s volatility, consolidation, or potential trend continuation.
Custom Color Options: Tailor the color settings for each killzone to fit your personal trading style and enhance the visual clarity of your chart.
User-Friendly Design: Built with simplicity in mind, this indicator integrates seamlessly into TradingView, making it easy for traders of all experience levels to utilize.
How to Use:
Add to Your Chart: Integrate the ICT Killzones with Market Behavior indicator into your TradingView setup.
Monitor Market Conditions: Keep an eye on the highlighted timeframes and the real-time insights displayed at the top. This information can guide your trading strategy effectively.
Adjust Your Approach: Use the insights from the indicator to modify your trading decisions based on the expected market behavior during each session.
Note: This indicator is for educational purposes only and should not be interpreted as financial advice. Always perform your own research and assess risks before making any trading decisions.
보호된 스크립트입니다
이 스크립트는 비공개 소스로 게시됩니다. 하지만 이를 자유롭게 제한 없이 사용할 수 있습니다 – 자세한 내용은 여기에서 확인하세요.
면책사항
해당 정보와 게시물은 금융, 투자, 트레이딩 또는 기타 유형의 조언이나 권장 사항으로 간주되지 않으며, 트레이딩뷰에서 제공하거나 보증하는 것이 아닙니다. 자세한 내용은 이용 약관을 참조하세요.
면책사항
해당 정보와 게시물은 금융, 투자, 트레이딩 또는 기타 유형의 조언이나 권장 사항으로 간주되지 않으며, 트레이딩뷰에서 제공하거나 보증하는 것이 아닙니다. 자세한 내용은 이용 약관을 참조하세요.