OPEN-SOURCE SCRIPT
업데이트됨 multi-tf standard devs [keypoems]
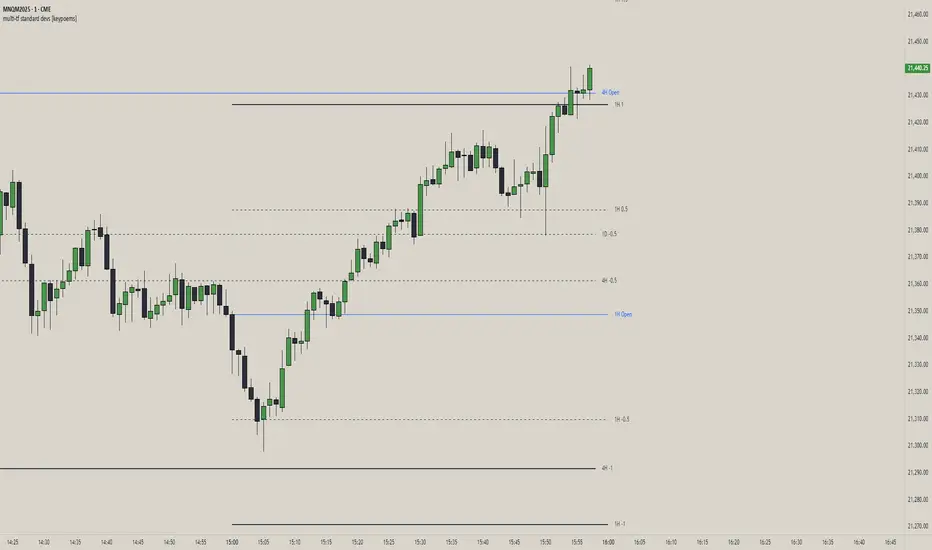
Multi-Timeframe Standard Deviations Levels
A visual map of “how far is too far” across any three higher time-frames.
1. What it does
This script plots dynamic price “rails” built from standard deviation (StDev)—the same math that underpins the bell curve—on up to three higher-time-frames (HTFs) at once.
• It measures the volatility of intraday open-to-close increments, reaching back as far as 5000 bars (≈ 20 years on daily data).
• Each HTF can be extended to the next session or truncated at session close for tidy dashboards.
• Lines can be mirrored so you see symmetric positive/negative bands, and optional background fills shade the “probability cone.”
Because ≈ 68 % of moves live inside ±1 StDev, ≈ 95 % inside ±2, and ≈ 99.7 % inside ±3, the plot instantly shows when price is statistically stretched or compressed.
3. Key settings
Higher Time-Frame #1-3 Turn each HTF on/off, pick the interval (anything from 1 min to 1 year), and decide whether lines should extend into the next period.
Show levels for last X days Keep your chart clean by limiting how many historical sessions are displayed (1-50).
Based on last X periods Length of the StDev sample. Long look-backs (e.g. 5 000) iron-out day-to-day noise; short look-backs make the bands flex with recent volatility.
Fib Settings Toggle each multiple, line thickness/style/colour, label size, whether to print the numeric level, the live price, the HTF label, and whether to tint the background (choose your own opacity).
4. Under-the-hood notes
StDev is calculated on (close – open) / open rather than absolute prices, making the band width scale-agnostic.
Watch for tests of ±1:
Momentum traders ride the breakout with a target at the next band.
Mean-reversion traders wait for the first stall candle and trade back to zero line or VWAP.
Bottom line: Multi-Timeframe Standard-Deviations turns raw volatility math into an intuitive “price terrain map,” helping you instantly judge whether a move is ordinary, stretched, or extreme—across the time-frames that matter to you.
Original code by fadizeidan and stats by NQStats's ProbableChris.
릴리즈 노트
Changelog (internal version v16): - Bugfix: pruning of older periods fib levels now works according to settings.
릴리즈 노트
Changelog: (internal version v30)- Fix memory leaks and refactor code to reduce memory footprint.
오픈 소스 스크립트
트레이딩뷰의 진정한 정신에 따라, 이 스크립트의 작성자는 이를 오픈소스로 공개하여 트레이더들이 기능을 검토하고 검증할 수 있도록 했습니다. 작성자에게 찬사를 보냅니다! 이 코드는 무료로 사용할 수 있지만, 코드를 재게시하는 경우 하우스 룰이 적용된다는 점을 기억하세요.
면책사항
해당 정보와 게시물은 금융, 투자, 트레이딩 또는 기타 유형의 조언이나 권장 사항으로 간주되지 않으며, 트레이딩뷰에서 제공하거나 보증하는 것이 아닙니다. 자세한 내용은 이용 약관을 참조하세요.
오픈 소스 스크립트
트레이딩뷰의 진정한 정신에 따라, 이 스크립트의 작성자는 이를 오픈소스로 공개하여 트레이더들이 기능을 검토하고 검증할 수 있도록 했습니다. 작성자에게 찬사를 보냅니다! 이 코드는 무료로 사용할 수 있지만, 코드를 재게시하는 경우 하우스 룰이 적용된다는 점을 기억하세요.
면책사항
해당 정보와 게시물은 금융, 투자, 트레이딩 또는 기타 유형의 조언이나 권장 사항으로 간주되지 않으며, 트레이딩뷰에서 제공하거나 보증하는 것이 아닙니다. 자세한 내용은 이용 약관을 참조하세요.