OPEN-SOURCE SCRIPT
업데이트됨 Price vs 200 EMA Indicator
Purpose:
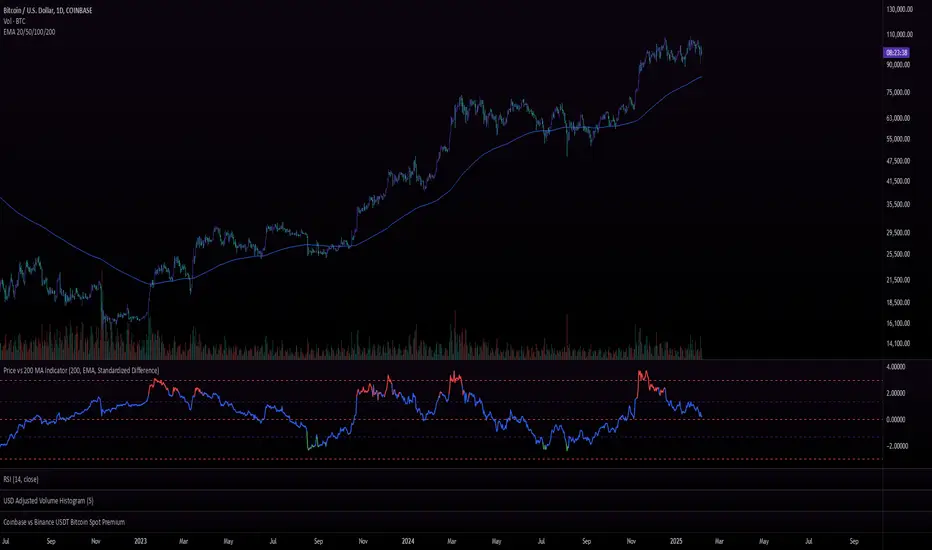
The Price vs. 200 MA (EMA) Indicator measures the deviation of the current price from its 200-period Exponential Moving Average (EMA). Instead of merely plotting the raw difference, the indicator calculates a standardized difference (similar to a z-score), which quantifies the deviation in terms of standard deviations over time. This helps traders understand how extreme the price is relative to its long-term average and its typical volatility.
Use Cases:
Trend Analysis:
Mean Reversion Strategy:
Trend Continuation or Exhaustion:
Summary:
The Price vs. 200 MA (EMA) Indicator calculates the standardized difference (z-score) between the price and its 200-period EMA, giving traders a normalized measure of how far the price is from its long-term average, relative to typical price volatility. The color-coded plot provides a clear visual representation of potential overbought/oversold conditions and highlights when the price has deviated significantly from the 200 EMA in either direction.
The Price vs. 200 MA (EMA) Indicator measures the deviation of the current price from its 200-period Exponential Moving Average (EMA). Instead of merely plotting the raw difference, the indicator calculates a standardized difference (similar to a z-score), which quantifies the deviation in terms of standard deviations over time. This helps traders understand how extreme the price is relative to its long-term average and its typical volatility.
Use Cases:
Trend Analysis:
Traders can use the standardized difference to assess how extreme the current price is relative to its long-term trend (200 EMA) while normalizing for volatility.
When the z-score approaches extreme levels (e.g., above 2 or below -2), it may indicate that the asset is overextended in either direction.
Mean Reversion Strategy:
Since the indicator identifies when the price deviates far from the 200 EMA (in terms of standard deviations), traders can use it to time mean-reversion trades, buying when the price is below -2 (oversold) and selling when it’s above +2 (overbought).
Trend Continuation or Exhaustion:
If the price continues to stay above +2 for extended periods, it could indicate a strong trend, whereas a reversion toward the EMA after reaching +2 or -2 could signal trend exhaustion or reversal.
Summary:
The Price vs. 200 MA (EMA) Indicator calculates the standardized difference (z-score) between the price and its 200-period EMA, giving traders a normalized measure of how far the price is from its long-term average, relative to typical price volatility. The color-coded plot provides a clear visual representation of potential overbought/oversold conditions and highlights when the price has deviated significantly from the 200 EMA in either direction.
릴리즈 노트
Added option to change MA length.릴리즈 노트
Added lines at 1.33 & -1.33Flags for crossing 0 are defaulted to off
릴리즈 노트
.릴리즈 노트
.오픈 소스 스크립트
트레이딩뷰의 진정한 정신에 따라, 이 스크립트의 작성자는 이를 오픈소스로 공개하여 트레이더들이 기능을 검토하고 검증할 수 있도록 했습니다. 작성자에게 찬사를 보냅니다! 이 코드는 무료로 사용할 수 있지만, 코드를 재게시하는 경우 하우스 룰이 적용된다는 점을 기억하세요.
면책사항
해당 정보와 게시물은 금융, 투자, 트레이딩 또는 기타 유형의 조언이나 권장 사항으로 간주되지 않으며, 트레이딩뷰에서 제공하거나 보증하는 것이 아닙니다. 자세한 내용은 이용 약관을 참조하세요.
오픈 소스 스크립트
트레이딩뷰의 진정한 정신에 따라, 이 스크립트의 작성자는 이를 오픈소스로 공개하여 트레이더들이 기능을 검토하고 검증할 수 있도록 했습니다. 작성자에게 찬사를 보냅니다! 이 코드는 무료로 사용할 수 있지만, 코드를 재게시하는 경우 하우스 룰이 적용된다는 점을 기억하세요.
면책사항
해당 정보와 게시물은 금융, 투자, 트레이딩 또는 기타 유형의 조언이나 권장 사항으로 간주되지 않으며, 트레이딩뷰에서 제공하거나 보증하는 것이 아닙니다. 자세한 내용은 이용 약관을 참조하세요.