OPEN-SOURCE SCRIPT
업데이트됨 Trend Master
Notes:
Tradingview has strict house rules of not allowing Heikin Ashi charts (and others beside normal price chart) to be used together with the indicator for trend analysis.
However, there may be users already using previous version of Trend Master but unfortunately has been hidden by Tradingview.
In view of this I decided to re-post the updated version, with the use of normal price chart only. Hope this help.
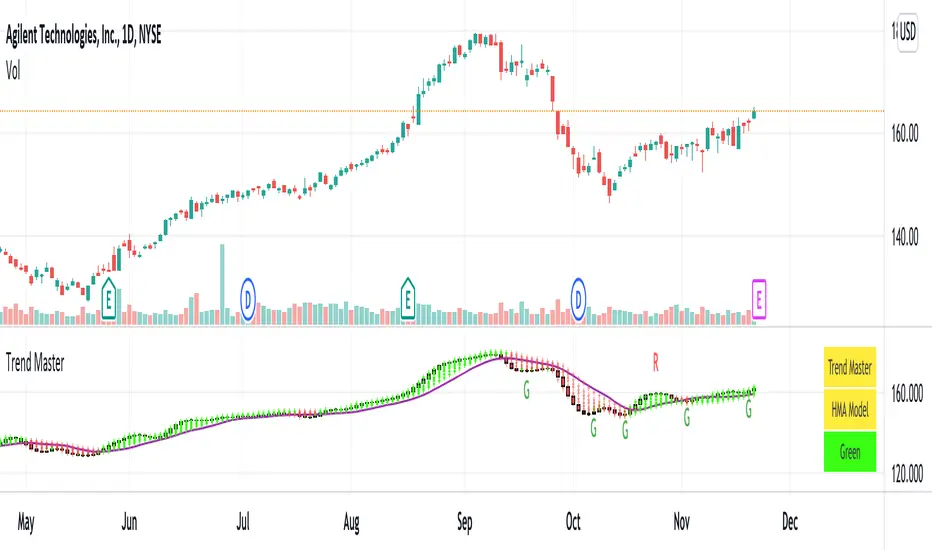
1. Trend Master, an indicator for trend analysis with the use of normal price chart.
2. Trend Master candle is in the form of solid candle without upper and lower tails.
The candle is in green color during an uptrend and red color during a downtrend.
When candle changes from red color to green color, it may signify the potential change from a down trend to an uptrend, vice versa.
3. Users can select the trend analysis model as they see fit, namely EMA , SMA , WMA and HMA .
4. Moving average lines of Trend Master are also included. Default is SMA13, the rest are SMA5, SMA21.
5. Users can turn on Rainbows if needed, it may help to detect the small changes of trend, if any.
6. A table of Indicator Name, Trend Model and Trend status is included. User can turn on to see the details.
Comments are welcome to further improve the accuracy of indicator that will benefit public users. Hope this help.
Disclaimer : attached chart is for the purpose of illustrating the indicator, no recommendation on buy/sell
Tradingview has strict house rules of not allowing Heikin Ashi charts (and others beside normal price chart) to be used together with the indicator for trend analysis.
However, there may be users already using previous version of Trend Master but unfortunately has been hidden by Tradingview.
In view of this I decided to re-post the updated version, with the use of normal price chart only. Hope this help.
1. Trend Master, an indicator for trend analysis with the use of normal price chart.
2. Trend Master candle is in the form of solid candle without upper and lower tails.
The candle is in green color during an uptrend and red color during a downtrend.
When candle changes from red color to green color, it may signify the potential change from a down trend to an uptrend, vice versa.
3. Users can select the trend analysis model as they see fit, namely EMA , SMA , WMA and HMA .
4. Moving average lines of Trend Master are also included. Default is SMA13, the rest are SMA5, SMA21.
5. Users can turn on Rainbows if needed, it may help to detect the small changes of trend, if any.
6. A table of Indicator Name, Trend Model and Trend status is included. User can turn on to see the details.
Comments are welcome to further improve the accuracy of indicator that will benefit public users. Hope this help.
Disclaimer : attached chart is for the purpose of illustrating the indicator, no recommendation on buy/sell
릴리즈 노트
revision 2, 22Nov21, convert to scripts version 5. Table size adjustable. Allow input on Trend Moving Average Length. 오픈 소스 스크립트
트레이딩뷰의 진정한 정신에 따라, 이 스크립트의 작성자는 이를 오픈소스로 공개하여 트레이더들이 기능을 검토하고 검증할 수 있도록 했습니다. 작성자에게 찬사를 보냅니다! 이 코드는 무료로 사용할 수 있지만, 코드를 재게시하는 경우 하우스 룰이 적용된다는 점을 기억하세요.
면책사항
해당 정보와 게시물은 금융, 투자, 트레이딩 또는 기타 유형의 조언이나 권장 사항으로 간주되지 않으며, 트레이딩뷰에서 제공하거나 보증하는 것이 아닙니다. 자세한 내용은 이용 약관을 참조하세요.
오픈 소스 스크립트
트레이딩뷰의 진정한 정신에 따라, 이 스크립트의 작성자는 이를 오픈소스로 공개하여 트레이더들이 기능을 검토하고 검증할 수 있도록 했습니다. 작성자에게 찬사를 보냅니다! 이 코드는 무료로 사용할 수 있지만, 코드를 재게시하는 경우 하우스 룰이 적용된다는 점을 기억하세요.
면책사항
해당 정보와 게시물은 금융, 투자, 트레이딩 또는 기타 유형의 조언이나 권장 사항으로 간주되지 않으며, 트레이딩뷰에서 제공하거나 보증하는 것이 아닙니다. 자세한 내용은 이용 약관을 참조하세요.