PROTECTED SOURCE SCRIPT
DistributionDays_FTD_iDavinderK
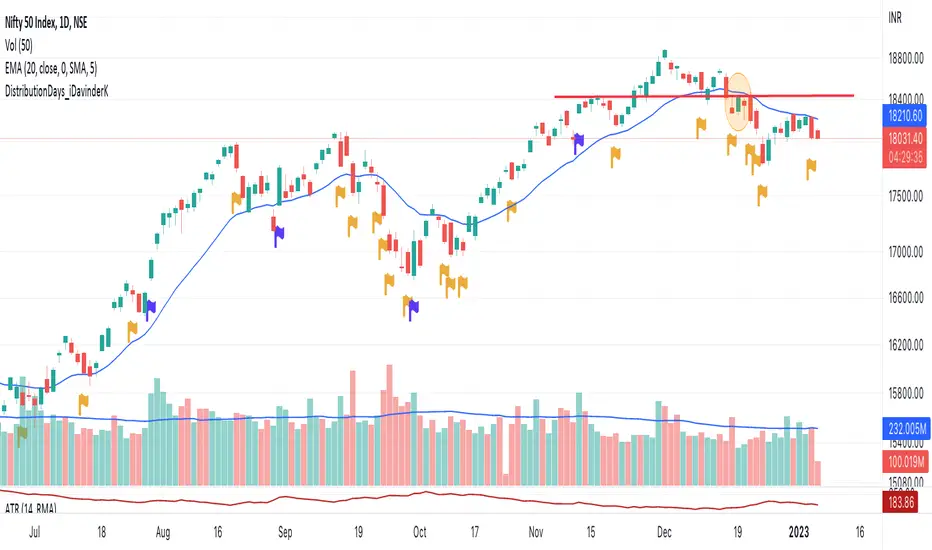
This script identifies the distribution days and follow through day.
DD count helps a trader identify a general trend of the market. A distribution day is flagged when index drops more than 0.2% and above average vols than previous day. 4 or more distribution days shows choppiness in the market and longs are unlikely to work.
A follow through day on the other hand shows strong buying emerges from the bottom. An FTD is flagged when index moves up 1.5% or more on higher vols than previous day.
Once an FTD is seen DD count goes back to zero.
DD are shown as Yellow flag here.
FTD are shown as Blue flag,
보호된 스크립트입니다
이 스크립트는 비공개 소스로 게시됩니다. 하지만 이를 자유롭게 제한 없이 사용할 수 있습니다 – 자세한 내용은 여기에서 확인하세요.
면책사항
해당 정보와 게시물은 금융, 투자, 트레이딩 또는 기타 유형의 조언이나 권장 사항으로 간주되지 않으며, 트레이딩뷰에서 제공하거나 보증하는 것이 아닙니다. 자세한 내용은 이용 약관을 참조하세요.
면책사항
해당 정보와 게시물은 금융, 투자, 트레이딩 또는 기타 유형의 조언이나 권장 사항으로 간주되지 않으며, 트레이딩뷰에서 제공하거나 보증하는 것이 아닙니다. 자세한 내용은 이용 약관을 참조하세요.