OPEN-SOURCE SCRIPT
CakeProfits-SMA+EMA G
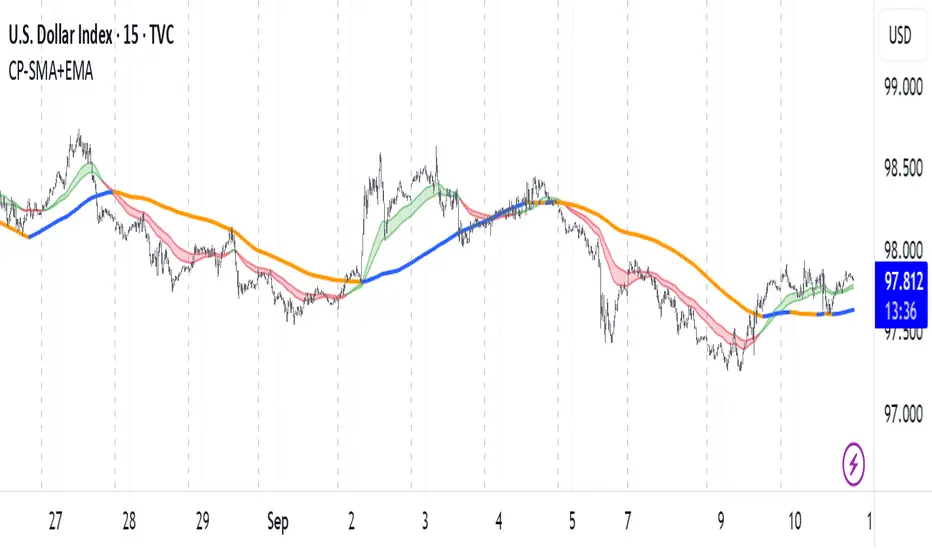
This indicator plots a dynamic color coded MA ribbon that visually highlights the relationship between a Simple Moving Average (SMA) and an Exponential Moving Average (EMA). The ribbon changes color based on bullish or bearish crossovers:
Bullish – EMA crosses above the SMA, indicating upward momentum.
Bearish – EMA crosses below the SMA, signaling potential downward pressure.
The SMA smooths out long-term price trends, while the EMA responds faster to recent price action. Together, they help traders identify shifts in market direction and momentum strength. The ribbon provides a clear, at-a-glance view of trend changes and can be used on any timeframe or market.
There is also the option to display a 200 SMA that is also color coded.
Common Uses:
Confirming trend direction.
Identifying early entry/exit points.
Filtering trades for trend-following strategies.
오픈 소스 스크립트
진정한 트레이딩뷰 정신에 따라 이 스크립트 작성자는 트레이더가 기능을 검토하고 검증할 수 있도록 오픈소스로 공개했습니다. 작성자에게 찬사를 보냅니다! 무료로 사용할 수 있지만 코드를 다시 게시할 경우 하우스 룰이 적용된다는 점을 기억하세요.
면책사항
이 정보와 게시물은 TradingView에서 제공하거나 보증하는 금융, 투자, 거래 또는 기타 유형의 조언이나 권고 사항을 의미하거나 구성하지 않습니다. 자세한 내용은 이용 약관을 참고하세요.
오픈 소스 스크립트
진정한 트레이딩뷰 정신에 따라 이 스크립트 작성자는 트레이더가 기능을 검토하고 검증할 수 있도록 오픈소스로 공개했습니다. 작성자에게 찬사를 보냅니다! 무료로 사용할 수 있지만 코드를 다시 게시할 경우 하우스 룰이 적용된다는 점을 기억하세요.
면책사항
이 정보와 게시물은 TradingView에서 제공하거나 보증하는 금융, 투자, 거래 또는 기타 유형의 조언이나 권고 사항을 의미하거나 구성하지 않습니다. 자세한 내용은 이용 약관을 참고하세요.