INVITE-ONLY SCRIPT
업데이트됨 Buy and Sell with Master_in_chart-ind. [V1]
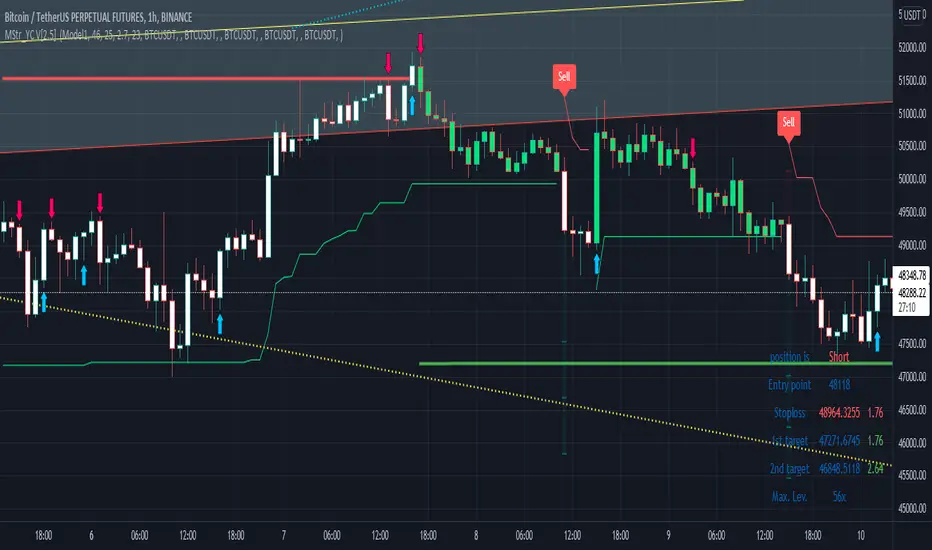
This script indicates the Buy and Sell positions on your chart. In addition, it shows entry price, stop loss and possible targets on the chart. The same information are shown in a table where you can find the position type (long/short) in green and red color, entry point, stop-loss (always in red) and targets.
The targets are defined by Risk to Reward ratios 1:1, 1:1.5 and 1:2.
the labels appears when the all conditions are satisfied.
Interesting part of the script is the alert function. Here one can set the script for different
securities and activate alert in TV.
In summary, one can change and tune the setting of the indicator easily by clicking on the gear icon. In the setting, there are four sections. First section sets the slop-loss. Second section activates and shows the super trend indicator. Third section is designed to tune the signals. Finally, you can apply the script on five different symbols at different time-frames. Here you can set alarm to alert you the signals.
I hope you enjoy it!
릴리즈 노트
minor corrections applied to the script릴리즈 노트
- Stop loss formula is modified
- circles are added to indicate Buy/Sell warnings
- Alerts are modified
릴리즈 노트
In version 2 the following updates are applied:- The functionality of indicator improved.
- Initial indication (suggestion) is promoted
- Initial indication illustrated by up/down arrows
- Input source is modified
릴리즈 노트
mistyping corrections applied릴리즈 노트
bars are colored based on super trend indicator in this release. In addition the color codes are modified to be compatible with TV structure.릴리즈 노트
In this version the following changes are applied:- Super Trend in higher time-frame is available now. There fore one can easily compare the trend in current time-frame and higher time-frame. By turning on this option, one can have an appropriate perspective on the trend.
- the same idea applied by coloring candles. I mean that candles are colored in red and green while the super trends in different time-frames are in a same color respectively. if their colors differ, then the candles are in white.
- A new model applied to modify the stop loss and signal labels
릴리즈 노트
In this update, - Setting panel is organized
- pivot point forecast option is added. By turning on this option, one can see two vertical lines in green and red that they show the possible position of the pivot points. users are able to change the length directly in the setting
- Now users are able to apply super trend in current time frame and the higher time frame independently.
릴리즈 노트
The alert now displays all signal values. As a result, when the signal is alerted, the entry point, stop loss, and first target corresponding to R:R = 1:1 are displayed.초대 전용 스크립트
이 스크립트는 작성자가 승인한 사용자만 접근할 수 있습니다. 사용하려면 요청 후 승인을 받아야 하며, 일반적으로 결제 후에 허가가 부여됩니다. 자세한 내용은 아래 작성자의 안내를 따르거나 master-in-chart에게 직접 문의하세요.
트레이딩뷰는 스크립트의 작동 방식을 충분히 이해하고 작성자를 완전히 신뢰하지 않는 이상, 해당 스크립트에 비용을 지불하거나 사용하는 것을 권장하지 않습니다. 커뮤니티 스크립트에서 무료 오픈소스 대안을 찾아보실 수도 있습니다.
작성자 지시 사항
The current version is [V2.5].
I am working on it to add more options and promote its functionality
If you are interested in using this indicator, just leave me a message in TradingView directly.
면책사항
해당 정보와 게시물은 금융, 투자, 트레이딩 또는 기타 유형의 조언이나 권장 사항으로 간주되지 않으며, 트레이딩뷰에서 제공하거나 보증하는 것이 아닙니다. 자세한 내용은 이용 약관을 참조하세요.
초대 전용 스크립트
이 스크립트는 작성자가 승인한 사용자만 접근할 수 있습니다. 사용하려면 요청 후 승인을 받아야 하며, 일반적으로 결제 후에 허가가 부여됩니다. 자세한 내용은 아래 작성자의 안내를 따르거나 master-in-chart에게 직접 문의하세요.
트레이딩뷰는 스크립트의 작동 방식을 충분히 이해하고 작성자를 완전히 신뢰하지 않는 이상, 해당 스크립트에 비용을 지불하거나 사용하는 것을 권장하지 않습니다. 커뮤니티 스크립트에서 무료 오픈소스 대안을 찾아보실 수도 있습니다.
작성자 지시 사항
The current version is [V2.5].
I am working on it to add more options and promote its functionality
If you are interested in using this indicator, just leave me a message in TradingView directly.
면책사항
해당 정보와 게시물은 금융, 투자, 트레이딩 또는 기타 유형의 조언이나 권장 사항으로 간주되지 않으며, 트레이딩뷰에서 제공하거나 보증하는 것이 아닙니다. 자세한 내용은 이용 약관을 참조하세요.